Introduction
Investing in stocks requires a thorough analysis of the company’s fundamentals, recent projects, future scope, and technical parameters. In this article, we will take a detailed look at Indian Railway Finance Corporation (IRFC) stock, including its fundamentals, recent projects, future outlook, and technical analysis. Please note, this review does not provide buy or sell recommendations and is based on data available on platforms like Groww, Moneycontrol and Zerodha. Also, Don’t forget to keep following inveshares for more such awesome stock picks!
Company Background (IRFC Stock)
History and Establishment
Indian Railway Finance Corporation (IRFC) was established in 1986 as a dedicated financing arm of the Indian Railways. Its primary purpose is to raise funds from the market to support the development and expansion of the Indian Railways infrastructure.The IRFC Stock got listed on BSE, NSE on January 29, 2021
Role in Indian Railways
IRFC plays a critical role in financing the procurement of rolling stock assets, which include locomotives, coaches, and wagons. It also supports railway projects and infrastructure development, making it an essential part of the Indian Railways ecosystem.
IRFC’s Project Portfolio
Recent Projects Acquired
IRFC has a significant role in funding the Indian Railways’ ambitious infrastructure development plans. The company has been actively involved in financing various projects which might indeed boost the IRFC Stock value, including:
- Dedicated Freight Corridors (DFCs): These high-speed rail lines exclusively for freight transport are aimed at improving the efficiency of goods movement across the country. IRFC has been a key financier for these mega projects.
- Railway Electrification: The transition to electric traction is a crucial step towards reducing carbon emissions and improving operational efficiency. IRFC has contributed substantially to funding the electrification of various rail routes.
- Station Modernization: Upgrading railway stations is essential for enhancing passenger experience. IRFC has been a major player in funding station redevelopment projects across India.
- Rolling Stock Procurement: The acquisition of new trains and coaches is vital for increasing capacity and improving passenger comfort. IRFC has financed the purchase of various types of rolling stock.
Pipeline of Projects For IRFC Stock
IRFC has a robust pipeline of projects, indicating a strong growth trajectory. The company is expected to continue playing a pivotal role in funding the Indian Railways’ expansion plans. This includes financing projects related to:
- High-speed rail corridors: India’s ambitious bullet train project and other high-speed rail initiatives are likely to require significant funding from IRFC.
- Metro rail projects: As urbanization progresses, the demand for metro rail systems is increasing. IRFC is expected to finance a substantial portion of these projects.
- Private participation in rail operations: The Indian government is encouraging private players to participate in rail operations. IRFC can potentially fund projects undertaken by these private entities.
Geographical Diversification
While the Indian Railways is IRFC’s core focus, there is potential for geographical diversification in the future. The company could explore opportunities in funding railway projects in other countries, especially those with developing economies and growing transportation needs. However, such expansion would require careful evaluation of risks and returns.

Future Outlook and Growth Drivers
Government Support and Policies
IRFC’s fortunes are closely tied to the Indian government’s focus on infrastructure development. The government’s consistent support for the railways, coupled with policies aimed at boosting the transportation sector, is a major tailwind for IRFC. Initiatives like the National Infrastructure Pipeline and the focus on logistics development are expected to create ample opportunities for the company. This might help with the value of IRFC Stock
Increasing Freight Traffic
India’s growing economy is driving the demand for efficient freight transportation. As the country’s industrial and manufacturing sectors expand, the railways are poised to play a crucial role in moving goods across the nation. This increased freight traffic will translate into higher revenue for IRFC as it finances the expansion of freight-related infrastructure.
Opportunities in Dedicated Freight Corridors
The development of dedicated freight corridors is a game-changer for the Indian Railways. These corridors are designed to significantly enhance freight transportation efficiency. IRFC is well-positioned to capitalize on these opportunities by providing the necessary financing for the construction and operation of these corridors.
Risks and Challenges
Interest Rate Risk
As a financial institution, IRFC is exposed to interest rate fluctuations. Rising interest rates can increase the cost of borrowing, impacting the company’s profitability. While IRFC can manage this risk through interest rate derivatives and asset-liability management, it remains a key challenge.
Competition
While IRFC enjoys a strong position as the primary financier of Indian Railways, competition from other financial institutions cannot be ignored. Banks, other NBFCs, and even international lenders might compete for railway projects, potentially impacting IRFC’s market share and pricing power.
Execution Risk
The success of IRFC depends on the timely and efficient execution of railway projects. Delays in project implementation, cost overruns, and unforeseen challenges can impact the company’s asset quality and profitability. Effective project management and risk mitigation strategies are crucial to address this risk.
Market Capitalization
Current Market Cap
As of July 2024, IRFC has a market capitalization of ₹2.397 trillion, making it one of the most valuable companies globally.
Historical Market Cap Data
| Year | Market Cap | Change (%) |
|---|---|---|
| 2024 | ₹2.397 T | 84.48% |
| 2023 | ₹1.299 T | 205.48% |
| 2022 | ₹425.43 B | 42.47% |
| 2021 | ₹298.61 B |
Market Cap Comparison For The IRFC Stock
On July 27th, 2024, multiple sources reported IRFC’s market cap as ₹2.397 trillion, confirming its significant market presence.
Revenue Analysis
Latest Revenue Figures
In 2024, IRFC reported a total revenue of ₹266.44 billion.
Revenue Trends from 2021 to 2024
| Year | Revenue | Change (%) |
|---|---|---|
| 2024 | ₹266.44 B | 1.11% |
| 2023 | ₹263.52 B | 11.81% |
| 2022 | ₹235.68 B | 25.34% |
| 2021 | ₹188.03 B |
IRFC has shown consistent revenue growth, reflecting its robust business model and effective financial strategies.
Earnings Analysis
Latest Earnings Figures For IRFC Stock
In 2024, IRFC’s earnings were ₹63.96 billion.
Earnings Trends from 2021 to 2024
| Year | Earnings | Change (%) |
|---|---|---|
| 2024 | ₹63.96 B | -42.63% |
| 2023 | ₹111.49 B | -6.74% |
| 2022 | ₹119.55 B | -0.7% |
| 2021 | ₹120.39 B |
Despite fluctuations, IRFC has maintained a strong earnings base, essential for its long-term sustainability.
Technical Analysis For The IRFC Stock
Stock Performance
IRFC’s stock has shown strong performance, reflecting investor confidence. Key technical indicators include:
- Moving Averages: The stock is trading above its 50-day and 200-day moving averages, indicating a bullish trend.
- Relative Strength Index (RSI): The RSI is currently in the neutral zone, suggesting balanced buying and selling pressures.
Valuation
Current Valuation
IRFC’s current valuation metrics suggest that the stock is trading at a premium:
- P/E Ratio: 38.7
- P/S Ratio: 8.92
- Price/Book Value: 3.78
Comparison with Industry Peers
Compared to its peers, IRFC’s valuation appears high, indicating that the market expects significant future growth.

Key Financial Ratios of IRFC Stock
Per Share Ratios
| Metric | Mar 24 | Mar 23 | Mar 22 | Mar 21 | Mar 20 |
|---|---|---|---|---|---|
| Basic EPS (₹) | 4.91 | 4.85 | 4.66 | 3.66 | 3.93 |
| Diluted EPS (₹) | 4.91 | 4.85 | 4.66 | 3.66 | 3.93 |
| Cash EPS (₹) | 4.91 | 4.86 | 4.67 | 3.38 | 3.11 |
| Book Value/Share (₹) | 37.63 | 34.79 | 31.37 | 27.48 | 26.06 |
| Dividend/Share (₹) | 1.50 | 1.50 | 1.40 | 1.05 | 0.17 |
| Revenue from Operations/Share (₹) | 20.39 | 18.28 | 15.53 | 12.07 | 11.65 |
| PBDIT/Share (₹) | 20.30 | 18.21 | 15.44 | 11.98 | 11.59 |
| PBIT/Share (₹) | 20.29 | 18.20 | 15.43 | 11.98 | 11.59 |
| PBT/Share (₹) | 4.91 | 4.85 | 4.66 | 3.38 | 3.11 |
| Net Profit/Share (₹) | 4.91 | 4.85 | 4.66 | 3.38 | 3.11 |
Profitability Ratios
| Metric | Mar 24 | Mar 23 | Mar 22 | Mar 21 | Mar 20 |
|---|---|---|---|---|---|
| PBDIT Margin (%) | 99.54 | 99.60 | 99.40 | 99.28 | 99.52 |
| PBIT Margin (%) | 99.50 | 99.54 | 99.33 | 99.25 | 99.52 |
| PBT Margin (%) | 24.06 | 26.52 | 30.00 | 28.00 | 26.68 |
| Net Profit Margin (%) | 24.06 | 26.52 | 30.00 | 28.00 | 26.68 |
Return Ratios
| Metric | Mar 24 | Mar 23 | Mar 22 | Mar 21 | Mar 20 |
|---|---|---|---|---|---|
| Return on Net Worth/Equity (%) | 13.03 | 13.93 | 14.85 | 12.29 | 11.92 |
| Return on Capital Employed (%) | 53.32 | 9.08 | 48.56 | 7.25 | 7.39 |
| Return on Assets (%) | 1.32 | 1.29 | 1.35 | 1.16 | 1.33 |
Debt Ratios
| Metric | Mar 24 | Mar 23 | Mar 22 | Mar 21 | Mar 20 |
|---|---|---|---|---|---|
| Total Debt/Equity (X) | 8.38 | 9.21 | 9.47 | 9.00 | 7.57 |
Liquidity Ratios
| Metric | Mar 24 | Mar 23 | Mar 22 | Mar 21 | Mar 20 |
|---|---|---|---|---|---|
| Current Ratio (X) | 1.09 | 2.08 | 1.06 | 2.28 | 3.06 |
| Quick Ratio (X) | 1.09 | 2.08 | 1.06 | 2.28 | 3.06 |
Valuation Ratios
| Metric | Mar 24 | Mar 23 | Mar 22 | Mar 21 | Mar 20 |
|---|---|---|---|---|---|
| Enterprise Value (Cr.) | 597,660.26 | 453,149.82 | 416,145.19 | 352,643.98 | – |
| EV/Net Operating Revenue (X) | 22.43 | 18.97 | 20.50 | 22.36 | – |
Analysis of Key Financial Ratios for IRFC Stock
Per Share Ratios
- Earnings Per Share (EPS):
- Basic and Diluted EPS: The EPS has shown a steady increase from ₹3.93 in 2020 to ₹4.91 in 2024. This indicates consistent profit growth, reflecting positively on the company’s profitability and shareholder returns.
- Cash EPS: The Cash EPS also shows a steady increase from ₹3.11 in 2020 to ₹4.91 in 2024, indicating strong cash flow generation.
- Book Value Per Share: This has increased from ₹26.06 in 2020 to ₹37.63 in 2024, suggesting that the company’s net worth per share has been growing, which is a positive indicator of financial health.
- Dividend Per Share: The dividend per share has increased from ₹0.17 in 2020 to ₹1.50 in 2024. This reflects the company’s commitment to returning value to its shareholders through dividends.
- Revenue from Operations Per Share: This has increased from ₹11.65 in 2020 to ₹20.39 in 2024, showing a strong growth in operational revenue, which is crucial for long-term sustainability.
Profitability Ratios
- PBDIT Margin: The PBDIT margin has remained extremely high and stable, above 99%, indicating efficient management and minimal operational costs.
- PBIT Margin: Similarly, the PBIT margin is above 99%, showcasing the company’s ability to maintain profitability after accounting for depreciation and amortization.
- PBT Margin: The PBT margin has shown some fluctuation, from 26.68% in 2020 to 24.06% in 2024. While it has slightly decreased, it remains healthy, indicating good profitability before tax.
- Net Profit Margin: The net profit margin has also fluctuated, from 26.68% in 2020 to 24.06% in 2024. This is a strong margin, reflecting the company’s ability to convert revenue into actual profit.
Return Ratios
- Return on Net Worth/Equity: This ratio has increased from 11.92% in 2020 to 13.03% in 2024, indicating an improved return on shareholders’ equity, which is positive for investors.
- Return on Capital Employed (ROCE): ROCE has shown a significant increase to 53.32% in 2024 from a much lower base in previous years. This suggests that the company is effectively using its capital to generate profits.
- Return on Assets (ROA): The ROA has been stable around 1.3%, indicating consistent returns from the company’s assets.
Debt Ratios
- Total Debt/Equity: This ratio has been high, increasing from 7.57 in 2020 to 8.38 in 2024. A high debt/equity ratio indicates a higher reliance on debt for financing, which can be risky but also signifies aggressive growth strategies.
Liquidity Ratios
- Current Ratio: The current ratio has seen a decline from 3.06 in 2020 to 1.09 in 2024. While it indicates that the company can cover its short-term liabilities with its short-term assets, the downward trend warrants attention.
- Quick Ratio: Similar to the current ratio, the quick ratio has decreased from 3.06 in 2020 to 1.09 in 2024. This reflects a decrease in the company’s immediate liquidity position.
Valuation Ratios
- Enterprise Value (EV): The enterprise value has increased significantly, reflecting the market’s high valuation of the company’s total value, including debt and equity.
- EV/Net Operating Revenue and EV/EBITDA: These ratios have remained relatively stable, indicating that the company’s valuation relative to its revenue and earnings remains consistent.
- MarketCap/Net Operating Revenue: This ratio has increased, indicating a higher market valuation relative to the company’s revenue, which can be seen as a sign of investor confidence.
- Price/BV and Price/Net Operating Revenue: These valuation ratios have increased, reflecting higher market valuation relative to the book value and operating revenue, indicating strong market confidence in the company.
Conclusion : Should You Buy IRFC Stock?
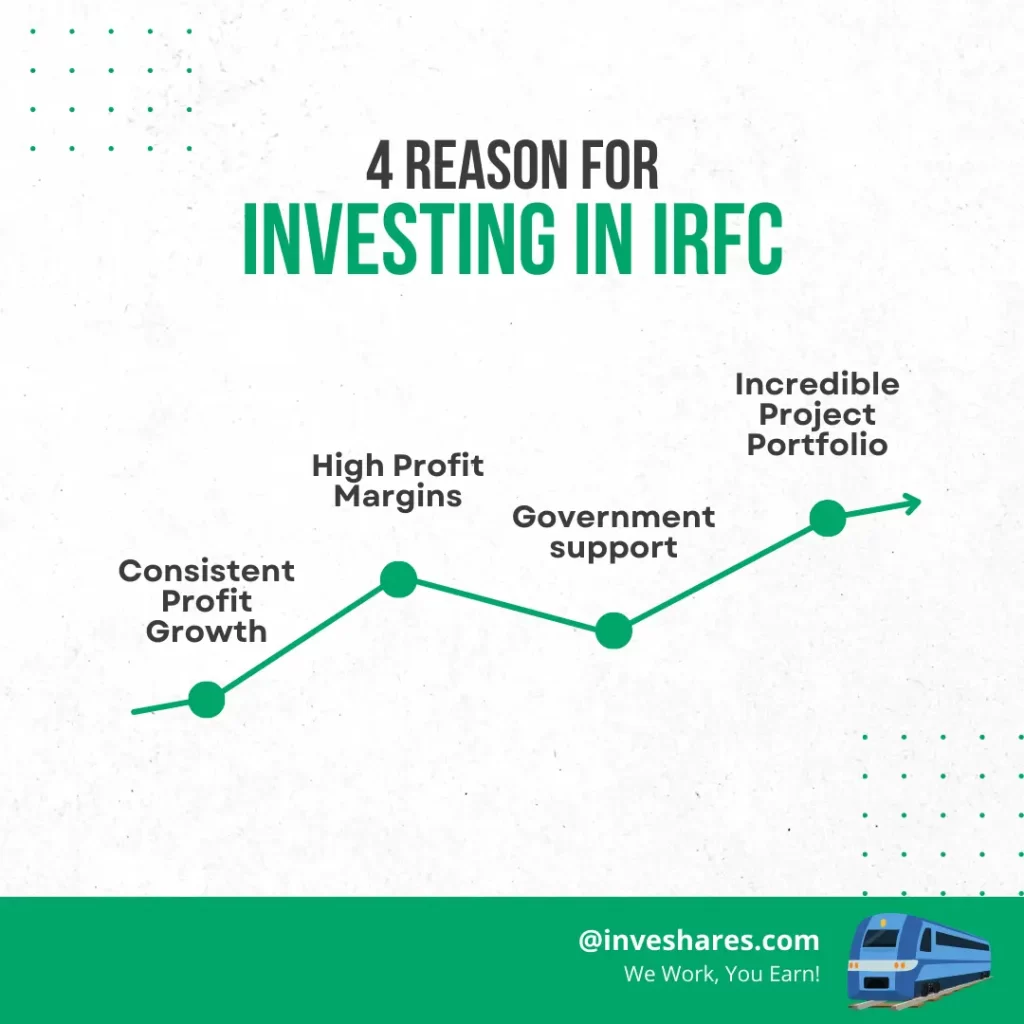
Why IRFC Remains a Good Investment Opportunity:
- Consistent Profit Growth: Steady increase in EPS and strong profitability margins indicate robust profit growth.
- Strong Revenue Growth: Continuous increase in revenue per share shows the company’s operational efficiency and growth potential.
- Dividend Payments: Increasing dividends per share reflect the company’s commitment to shareholder returns.
- High Profit Margins: Consistently high PBDIT and PBIT margins indicate efficient management and cost control.
- Improved Return Ratios: Increasing ROE and ROCE suggest effective use of capital and equity to generate profits.
- Market Confidence: High market capitalization and valuation ratios reflect strong investor confidence in the company’s future prospects.
Despite the high debt/equity ratio and declining liquidity ratios, the overall financial health, consistent profitability, and growth potential make IRFC a solid investment opportunity.
To Read About More Such Stocks, Please Keep Following Inveshares!
FAQ Section
Yes, Indian Railway Finance Corporation (IRFC) is considered a good investment in 2024 due to its consistent profit growth, strong revenue increases, and commitment to returning value to shareholders through dividends. The company’s high profitability margins and efficient use of capital also make it an attractive option for investors. However, potential investors should also consider the company’s high debt/equity ratio and assess their risk tolerance accordingly.
Key financial ratios of IRFC include Basic EPS of ₹4.91, Cash EPS of ₹4.91, Book Value per Share of ₹37.63, and a Dividend per Share of ₹1.50 as of March 2024. The PBDIT Margin is 99.54%, Net Profit Margin is 24.06%, and the Return on Equity is 13.03%. The Total Debt/Equity ratio is 8.38, and the Current Ratio is 1.09. These ratios indicate strong profitability and growth potential but also highlight a high reliance on debt.
The market capitalization of IRFC has shown significant growth over the past few years. In 2020, it was ₹298.61 billion, and it increased to ₹425.43 billion in 2022. By 2023, it had reached ₹1.299 trillion, and in 2024, it stands at ₹2.397 trillion. This substantial growth in market cap reflects increasing investor confidence and the company’s expanding valuation.
IRFC’s revenue has consistently increased over the years, from ₹188.03 billion in 2021 to ₹268.88 billion in 2024. However, earnings have shown some fluctuations, with a decrease from ₹119.55 billion in 2022 to ₹63.96 billion in 2024. Despite this, the company’s revenue growth and robust profit margins indicate a strong operational performance.
As of July 2024, IRFC’s P/E ratio is 38.7. A higher P/E ratio generally indicates that investors are willing to pay a premium for the company’s earnings potential. Compared to a P/E ratio of 6.55 at the end of 2022, the current ratio reflects increased investor confidence and a higher market valuation of the company’s future earnings prospects.
IRFC has consistently increased its dividend payouts over the years, from ₹0.17 per share in 2020 to ₹1.50 per share in 2024. This indicates the company’s strong commitment to returning value to its shareholders and providing consistent income through dividends.
The future growth prospects for IRFC are promising due to its strategic role in financing the Indian Railways. The continuous increase in revenue and consistent profitability indicate a strong foundation for future growth. Additionally, ongoing investments in railway infrastructure and expansion projects are likely to drive further growth.
IRFC stands out in its sector due to its robust financial performance, high profitability margins, and significant market capitalization. Its strategic importance in financing the Indian Railways gives it a unique position compared to other companies in the same sector. Investors may find IRFC’s consistent growth and strong financial metrics more attractive compared to its peers.
Before investing in IRFC stock, investors should consider the company’s high debt/equity ratio, recent fluctuations in earnings, and liquidity ratios. It is also important to assess the overall market conditions, the company’s future growth prospects, and their personal risk tolerance. Consulting with a financial advisor and conducting thorough research is recommended to make an informed investment decision.