In the fast-paced world of finance and trading, understanding price trends is crucial for making informed decisions. One invaluable resource that can aid traders and investors in this endeavor is the Candlestick Chart Pattern Book. This guide will take you through the ins and outs of candlestick chart patterns, providing you with the knowledge you need to navigate the complex world of price movements effectively.
Introduction: Unveiling the Power of Candlestick Chart Pattern Book
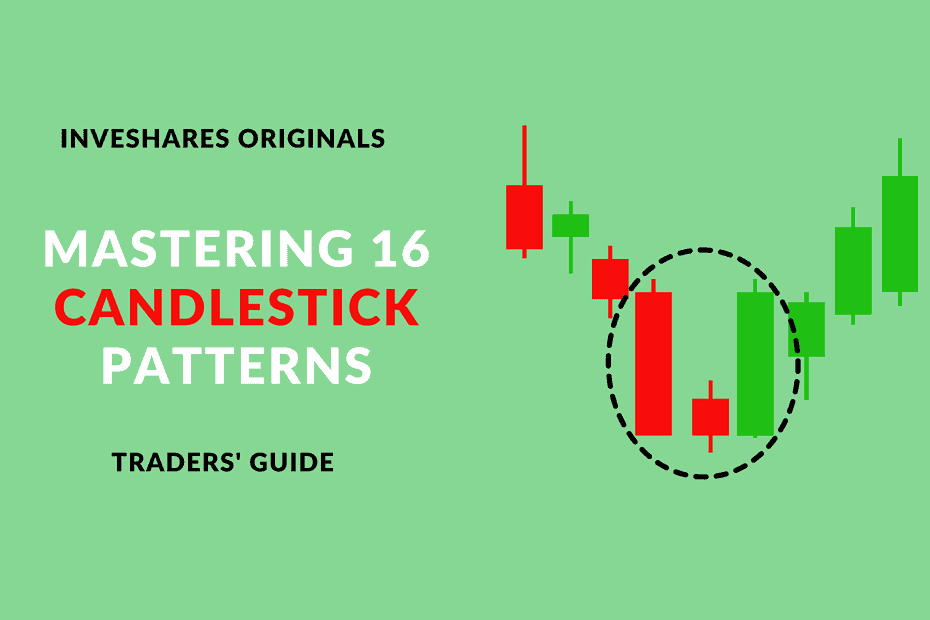
Whether you’re a seasoned trader or just starting in the world of finance, the term “candlestick chart patterns” holds immense significance. These patterns are visual representations of price movements over specific time periods, offering insights into potential market trends. By interpreting these patterns, traders can predict potential future price movements, gaining an edge in the market.
What is the Candlestick Chart Pattern Book?
Candlestick chart patterns are graphical representations of price movements in financial markets. They consist of “candles” that depict the opening, closing, high, and low prices of a security or asset within a specific time frame. These patterns can be simple, like the Hammer or Doji, or more complex, such as the Morning Star or Evening Star.
Candlestick chart patterns serve as tools for technical analysis, aiding traders in identifying trends, reversals, and market sentiment. These patterns are formed by combining multiple candles and are often accompanied by bullish and bearish signals, helping traders make informed decisions.
Types of Candlestick Chart Patterns From The Book
There is a wide array of candlestick chart patterns that traders use to analyze price trends. Some of the most commonly used patterns include:
- Bullish Patterns
- Hammer: A small body candle with a long lower shadow, indicating a potential reversal from a downtrend.
- Bullish Engulfing: A large bullish candle that engulfs the previous bearish candle, suggesting a possible trend reversal.
- Three White Soldiers: Three consecutive long bullish candles, signaling a strong uptrend.
- Bearish Patterns
- Shooting Star: A small-bodied candle with a long upper shadow, indicating a potential reversal from an uptrend.
- Bearish Engulfing: A large bearish candle that engulfs the previous bullish candle, suggesting a possible trend reversal.
- Three Black Crows: Three consecutive long bearish candles, signaling a strong downtrend.
Analysing Candlestick Chart Pattern Book
Analyzing candlestick chart patterns involves understanding the psychology behind price movements and market sentiment. Traders look for specific formations and combinations of candles to gauge potential future price movements. Here are a few steps to help you analyze these patterns effectively:
- Identify Patterns: Recognize various candlestick patterns and understand their implications.
- Consider Timeframes: Patterns can appear on different timeframes, so consider the context and select the appropriate timeframe for analysis.
- Confirmation Signals: Look for confirmation signals like volume trends and indicators to validate the pattern’s accuracy.
- Historical Context: Analyze patterns in the context of historical price movements to identify potential trend reversals.
Common Mistakes to Avoid
While candlestick chart patterns can provide valuable insights, it’s essential to avoid common mistakes that traders often make:
- Overlooking Confirmation: Relying solely on candlestick patterns without confirming signals from other technical indicators.
- Ignoring Context: Failing to consider the broader market context and relying solely on candlestick patterns.
- Neglecting Risk Management: Overcommitting to trades based solely on patterns without proper risk management.
The Art of Interpretation: Unveiling Market Sentiment
Interpreting candlestick chart patterns goes beyond merely identifying shapes on a chart. It involves delving into the psychology of market participants, understanding their emotions and reactions. For instance, a “Doji” pattern, characterized by a small body and almost equal opening and closing prices, signifies uncertainty and potential trend reversal. On the other hand, a “Hanging Man” pattern, despite its ominous name, often indicates a bullish reversal after a downtrend.
Crafting Your Trading Strategy
Armed with the insights from the Candlestick Chart Pattern Book, you can develop a robust trading strategy that combines candlestick patterns with other analytical tools. Your strategy should encompass risk management, entry and exit points, and a clear understanding of your risk tolerance.
FAQs about the Candlestick Chart Pattern Book
1. What is the Candlestick Chart Pattern Book?
The Candlestick Chart Pattern Book is a comprehensive guide that provides detailed explanations and illustrations of various candlestick chart patterns used in technical analysis.
2. How can the Candlestick Chart Pattern Book benefit traders?
The book equips traders with the knowledge needed to interpret candlestick patterns effectively, enabling them to make informed trading decisions based on historical price movements and market sentiment.
3. Are candlestick patterns foolproof indicators?
No, while candlestick patterns provide valuable insights, they should be used in conjunction with other technical and fundamental analysis tools for more accurate predictions.
4. Is the book suitable for beginners?
Yes, the book caters to both beginners and experienced traders, offering explanations of basic patterns as well as more advanced formations.
5. Can I use candlestick patterns for long-term investments?
Candlestick patterns are more commonly used for short to medium-term trading, but understanding price trends can also benefit long-term investors.
6. Are there real-world examples in the book?
Yes, the book often includes real-world examples of candlestick patterns in different market scenarios to enhance understanding.
Conclusion: Empowering Your Trading Journey
The Candlestick Chart Pattern Book serves as an indispensable tool for traders aiming to harness the power of technical analysis. By delving into the intricacies of candlestick patterns, you can gain a deeper understanding of price trends and market sentiment. Remember to use these patterns in conjunction with other analysis tools and indicators for more accurate predictions. With the insights gained from this guide, you’re well-equipped to navigate the dynamic world of financial markets.
To get more such Stock Market information keep following inveshares.com