Introduction : Candlestick Chart Patterns
Candlestick chart patterns are an easy way to spot the trends of a market and earn money in the market. While candlestick charting has been around since the 1800s, it is still used today in stock, crypto currency and forex trading. In this article, we will focus on a few types of candlestick chart patterns. This would be the most detailed and simplified guide to candlestick chart Patterns on the Internet.
Do Study and Master these awesome candlestick charts explained in this article for a great future in trading. Remember, the simpler the strategy the more frequently you earn.
What is Candlestick Chart Pattern?
In financial and technical evaluation, a candlestick pattern is a movement in prices shown graphically on a candlestick chart that some believe can predict a selected market motion. The recognition of the pattern is subjective and programs that are used for charting have to rely on predefined rules to fit the pattern. There are 42 known styles that may be split into simple and complex patterns
Candlestick Components And Explanation
Just like a bar chart, a daily candlestick shows the market’s open, high, low, and close price for the day. The candlestick has a wide part, which is called the “real body.”
This real body represents the price range between the open and close of that day’s trading. When the real body is filled in or black, it means the close was lower than the open. If the real body is empty, it means the close was higher than the open.
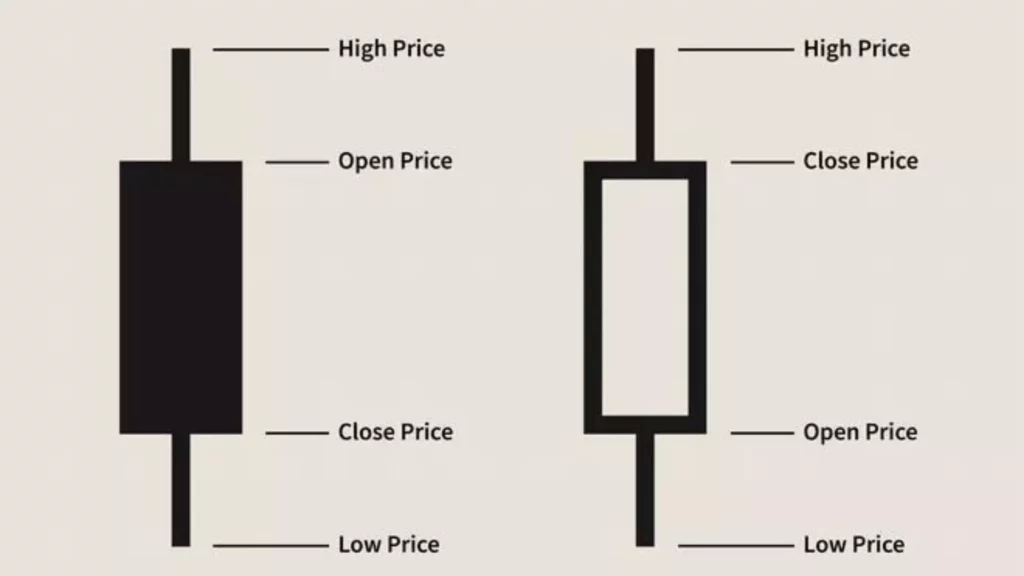
Traders can alter these colours in their trading platform. For example, a down candle is often shaded red instead of black, and up candles are often shaded green instead of white.
How To Use Candlestick Charts For Trading?
Candlestick charts are used by many traders to represent the price of a security over a given period.
These Three factors are important to know the Colour / Nature of the Candlesticks:
- The opening price of the security.
- The high and low of the security for that period.
- The closing price of the security.
When a candle is green, it means that the opening price was lower than the closing price. This indicates that buyers were in control of prices during this time period. When a candle is red, it means that the opening price was higher than the closing price. This indicates that sellers were in control of prices during the time period.
Most Useful Candlestick Chart Patterns
1.) Head and Shoulder pattern
this is the most essential chart sample in technical evaluation. Head and shoulder patterns are reversal patterns, and they may be usually shaped on the market tops. on this sample, the first left height is formed that is known as the left shoulder, and after that, price breaks the level of the left shoulder and immediately takes resistance from there forming the head of the pattern. After taking guide from the neckline, the price again attempts to move up further, but it takes resistance from above tiers forming the right shoulder, and then it breaks the neckline which shows the short entry.
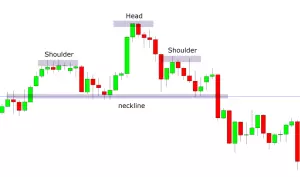
As we will see within the above figure, after taking rejection from the right shoulder, the stock has made a heavy red candle that confirms the breakdown from the neckline. when the price closes underneath the neckline, a potential short trade is signalled. generally, the target is equal to the vertical distance between the ‘apex’ of the head and shoulder and the distance from the neckline. After a exchange entry, if the price closes above the neckline, a potential failure of the sample is indicated so stop-loss can be set above the neckline.
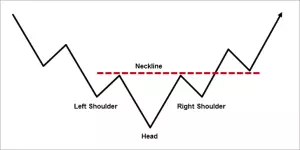
2.) Inverse Head and Shoulder pattern
Inverse head and shoulder pattern is exactly contrary as that of normal head and shoulder pattern.This pattern is shaped at the lowest of the downtrend and suggests the potential uptrend after the potential breakout from the trendline.
3.) Double top pattern
The Double top pattern is a trend reversal pattern that is commonly formed at the top of the uptrend indicating the potential reversal. in this pattern, price first makes the up move and takes resistance from a certain level, and after taking the help from the neckline, price again attempts to go up but takes the resistance from the same level indicating the formation of a double top sample.
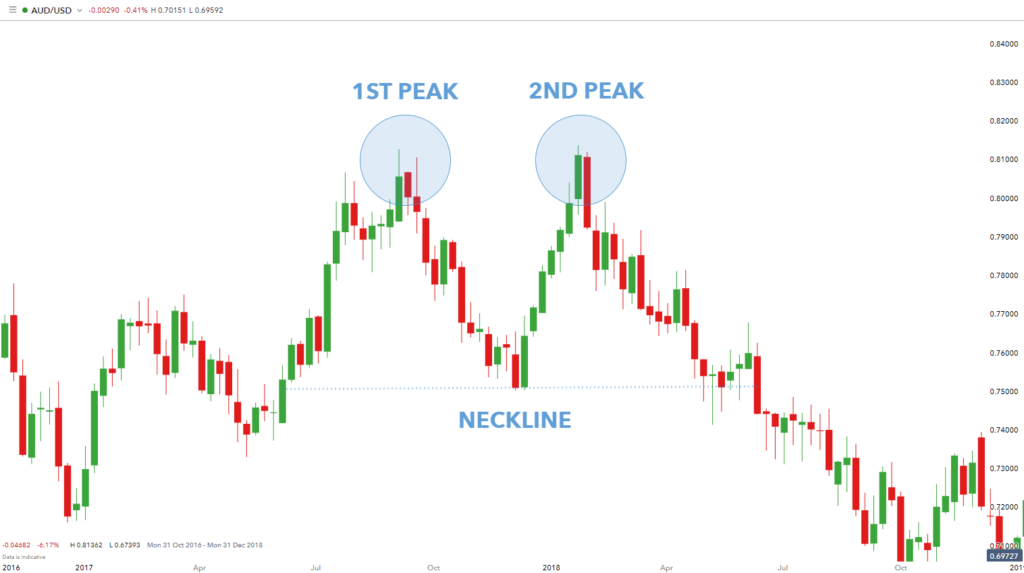
As we see within the above example, after taking the resistance from the equal level two times, the stock broke the trendline and dips below. A double top confirmation has occurred on the breakdown from the neckline and short trade can be initiated after this. Double top patterns offer a very good risk to reward ratio. The goal for this exchange is same to the distance between the top of the pattern to the neckline. sometimes, the double top pattern additionally fails and attempts to form triple or multiple top patterns which can be more potent than the double pinnacle pattern.
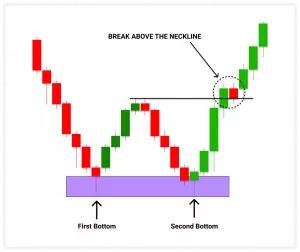
4.) Double Bottom Pattern
The Double bottom pattern is precisely the opposite of the double top sample. This pattern is generally formed on the end of the downtrend indicating a new uptrend after the breakout from the neckline.
5.) Ascending Triangle pattern
An ascending triangle is a bullish trend continuation pattern that confirms the continuation of an uptrend. The ascending triangle pattern is sure by using trendlines: a horizontal line on the top and an upward slope trend line connecting the lower lows. This sample is quite reliable compared to other styles.
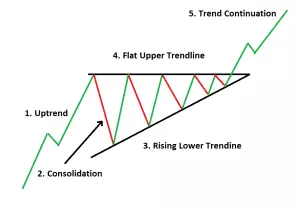
After the affirmation of the breakout from the top trendline, lengthy trade may be initiated. Ascending triangles can provide superb targets. the first goal would be same to the depth of the triangle. In short, calculate the gap between the top trendline and lowest of the down trendline and add this depth to the breakout factor, and this would be your target. additionally, targets can be set at 50% of depth for partial exits. place the stop loss order below the slope trendline.
6.) Descending Triangle pattern
A Descending Triangle pattern is a bearish trend continuation pattern that confirms the continuation of the downtrend. The descending triangle pattern is bound by trendlines; one is a downtrend slope trendline, and the other is a flat trendline that connects the lows of the pattern.
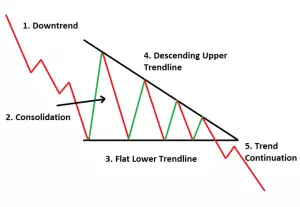
After the affirmation of the breakdown from the lower trendline, a brief trade can be initiated. The descending triangle can deliver superb targets. the primary goal might be identical to the depth of the triangle. additionally, partial earnings can be booked after the price reaches 50% of the triangle depth.
7.) Symmetrical Triangle pattern
This pattern forms when there may be indecision in the market. The symmetrical triangle pattern may be easily noticed when prices make lower highs and higher lows. these kinds of styles are formed when there is same supply and demand inside the market.
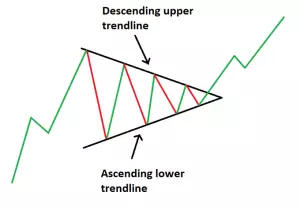
Trades can only be initiated at breakouts or breakdowns. enter an extended trade when rate breaks the descending upper trendline and sustains above it. sell trade can be initiated if the price breaks the lower trendline and sustains below it. maximum symmetric triangles supply 100% of the depth rise/fall of the entire triangle as a target. Symmetrical triangles failure takes place when price results in fake breakouts.Although, it is one of the very good Candlestick Chart Patterns.
8) Flag and Pole pattern
Flag and pole are the continuation patterns representing a small damage in market fashion. They may be easily spotted at the charts as they seem right after a quick breakout or breakdown from a trading range. In sturdy trending markets, flags are formed as prices consolidate for a while, and again begin to move in the equal path. these are very reliable patterns.
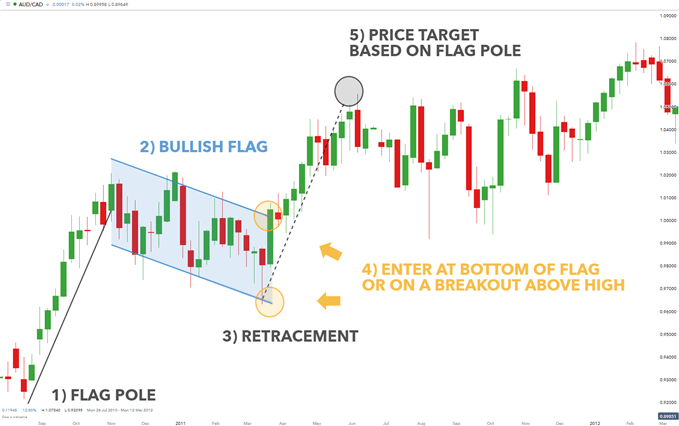
After the breakout from the earlier range, the price shoots up and makes lower highs and lower lows in case of bullish flag and pole, and in case of bearish flag and pole, the price makes higher highs and higher lows after breaking down from the preceding level. trade may be initiated once the price breaks the above trendline, and the goal may be set equal to the distance from the previous breakout to the first high of the flag (denoted by using ‘xy’).
In the case of a bearish flag and pole pattern, trade can be initiated when the price breaks down from a lower trendline, and the target can be equal to the distance from the preceding breakdown to the first support of the flag. (Denoted by ‘xy’). place a stop-loss order below the ‘low’ of the ‘flag’.
Conclusion : Wrapping things up!
Candlestick charting is a technical analysis tool that can be used to predict the future price movements of an asset. A candlestick chart provides a visual representation of the open, high, low and close prices for each period. While some traders may find candlestick charts difficult to understand at first, but this articles makes it super simple and easy to understand. Also, they are still widely used because of their accuracy in predicting market shifts.
If you are interested in learning more about trading terminologies please visit this link. Follow us on InveShares for more insights on trading! Happy Investing, Happy Life!