
Introduction: Ichimoku Cloud Indicator
If you’re interested in forex trading, you may have heard of the Ichimoku cloud indicator. This technical indicator, also known as the Ichimoku Kinko Hyo, is a versatile tool that can be used to identify trends, support and resistance levels, and potential buy and sell signals. In this article, we’ll discuss what the Ichimoku cloud indicator is and how to use it for forex trading.
What is the Ichimoku Cloud Indicator?
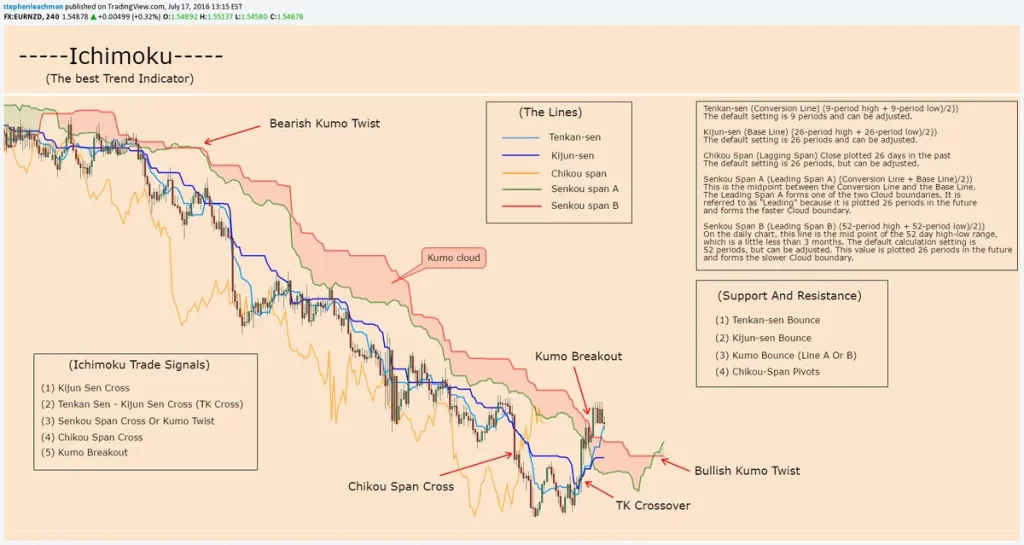
The Ichimoku cloud indicator is a technical indicator that was developed in the 1930s by a Japanese journalist named Goichi Hosoda. It consists of several components, including the conversion line (or tenkan sen), the base line (or kijun sen), the leading spans A and B (or senkou span A and B), and the lagging span (or chikou span).
The conversion line is a moving average of the highest high and the lowest low over the past nine periods. It is used to identify the short-term trend of the market. The base lineis a moving average of the highest high and the lowest low over the past 26 periods. It is used to identify the medium-term trend of the market.
The leading span A is the midpoint between the conversion line and the base line, plotted 26 periods in the future. It is used to identify the long-term trend of the market. The leading span B is the midpoint between the highest high and the lowest low over the past 52 periods, plotted 26 periods in the future. It is used to identify the long-term trend of the market and acts as a key support and resistance level. The lagging span is the closing price plotted 26 periods in the past. It is used to confirm trend and potential buy and sell signals.
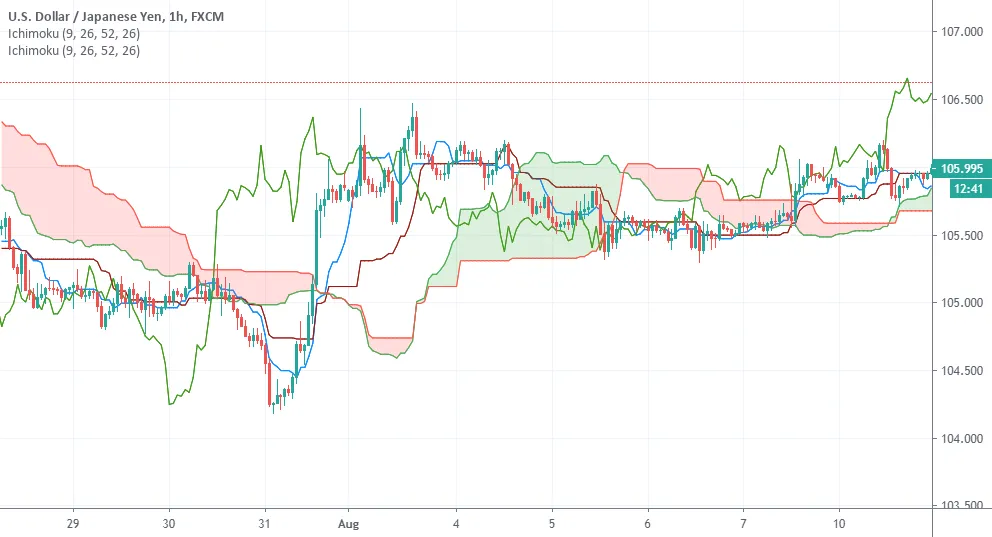
One of the unique features of the Ichimoku cloud indicator is that it provides a complete and visual representation of the market trend. It is called the “cloud” because the area between the leading span A and B is shaded, creating a visual representation of the market trend. When the cloud is green, it indicates a bullish trend. When the cloud is red, it indicates a bearish trend.
How to Use the Ichimoku Cloud Indicator for Forex Trading
The Ichimoku cloud indicator can be a useful tool for forex traders looking to identify trends and potential buy and sell signals. Here are some tips for using the Ichimoku cloud indicator in your trading:
1.Identify the market trend.
The Ichimoku cloud indicator can help you identify the direction of the market trend. If the conversion line is above the base line and the leading span A is above the leading span B, it indicates an uptrend. If the conversion line is below the base line and the leading span A is below the leading span B, it indicates a downtrend.
2.Identify key support and resistance levels.
The leading span A and B can act as key support and resistance levels. If the price is above the cloud, it indicates that the trend is bullish and the cloud acts as a support level. If the price is below the cloud, it indicates that the trend is bearish and the cloud acts as a resistance level.
3.Look for buy and sell signals.
The Ichimoku cloud indicator can also provide potential buy and sell signals. If the price is above the cloud and the lagging span crosses above the price, it may be a buy signal. If the price is below the cloud and the lagging span crosses below the price, it may be a sell signal. It’s important to note that these signals should not be relied upon solely when making trading decisions. Traders should consider a range of factors, such as market news and analysis, before making a trade.
4.Use the conversion and base lines for trade entries and exits.
The conversion and base lines can also be used as trade entry and exit points. If the price is above the conversion line and the conversion line is above the base line, it may be a good time to enter a long trade. If the price is below the conversion line and the conversion line is below the base line, it may be a good time to enter a short trade. The opposite can also be true for trade exits.
If the price is above the conversion line and the conversion line is below the base line, it may be a good time to exit a long trade. If the price is below the conversion line and the conversion lineis above the base line, it may be a good time to exit a short trade. It’s important to note that these trade entry and exit points should not be relied upon solely when making trading decisions. Traders should consider a range of factors, such as market news and analysis, before making a trade.
5.Use the Ichimoku cloud indicator in conjunction with other analysis tools.
While the Ichimoku cloud indicator can be a useful tool for identifying trends and potential trade signals, it’s important to use it in conjunction with other analysis tools. This can help to confirm trends and provide a more complete picture of the market. Some other analysis tools that traders may want to consider using in conjunction with the Ichimoku cloud indicator include fundamental analysis, technical analysis, and market news and analysis.
Conclusion
The Ichimoku cloud indicator is a versatile tool that can be used to identify trends, support and resistance levels, and potential buy and sell signals in forex trading. While it can be a useful tool, it’s important to consider a range of factors, such as market news and analysis, before making a trade. As with any technical indicator, it’s always a good idea to use the Ichimoku cloud indicator in conjunction with other analysis tools. By doing so, traders can get a more complete picture of the market and make more informed trading decisions.
To Know more such interesting information keep following InveShares right here!