Introduction: Risk Adjusted Returns
Risk-adjusted returns are a measure of the profitability of an investment that takes into account the level of risk involved. They allow investors to compare different investment options and make more informed decisions by considering both the potential returns and the risks associated with each option.
There are several different ways to measure risk-adjusted returns, including the Sharpe ratio and the Treynor ratio. The Sharpe ratio measures the excess return of an investment over the risk-free rate (such as the return on a U.S. Treasury bond) per unit of risk. The Treynor ratio measures the excess return of an investment over the risk-free rate per unit of systematic risk (also known as beta). Both of these measures can be useful for evaluating the performance of an investment or portfolio and comparing it to other options.
It is important to note that risk-adjusted returns are just one factor to consider when evaluating an investment. Other considerations may include the overall level of risk in the investment, the potential for long-term growth, and the investor’s own financial goals and risk tolerance. By considering a range of factors and using risk-adjusted returns as a guide, investors can make more informed decisions and potentially achieve better outcomes.
The importance of considering risk in investing:
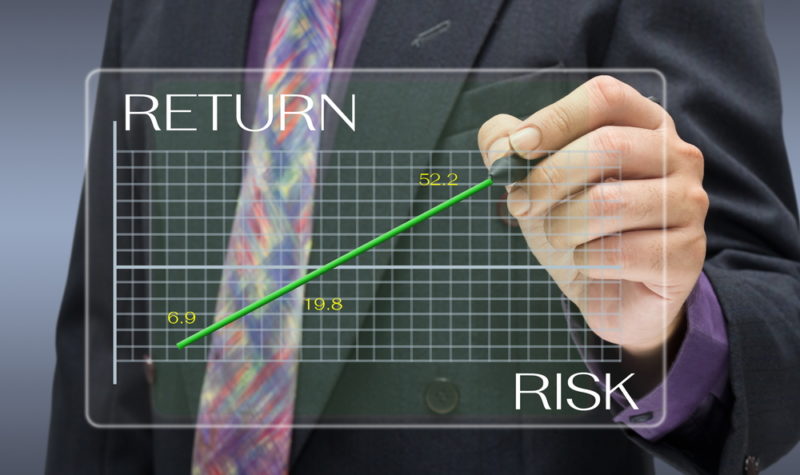
Risk is an inherent part of investing, and it is important for investors to consider the level of risk associated with any investment they are considering. Ignoring risk can lead to unexpected losses or missed opportunities, as investors may underestimate the potential downside of an investment or overestimate its potential returns.
On the other hand, by considering risk in their investment decisions, investors can potentially achieve higher returns and better outcomes. Risk-adjusted returns allow investors to compare different investment options and make more informed decisions by considering both the potential returns and the risks associated with each option. By choosing investments with a favorable risk-adjusted return profile, investors can potentially achieve higher returns while also minimizing the potential for losses. Overall, risk-adjusted returns can be a valuable tool for helping investors to make more informed and potentially more successful investment decisions.
Understanding The Sharpe ratio
The Sharpe ratio is a measure of the excess return of an investment over the risk-free rate per unit of risk. It is calculated as the difference between the investment’s return and the risk-free rate, divided by the standard deviation of the investment’s returns.
For example, let’s say an investor is considering two different investments: Investment A has a return of 10% and a standard deviation of 5%, while Investment B has a return of 8% and a standard deviation of 3%. The Sharpe ratio for Investment A would be (10%-0%)/5% = 2, while the Sharpe ratio for Investment B would be (8%-0%)/3% = 2.67. In this case, Investment B has a higher Sharpe ratio, indicating that it has a better risk-adjusted return profile.
The Sharpe ratio can be a useful tool for comparing the risk-adjusted returns of different investments or portfolios. However, it has a few limitations to consider. For example, it assumes that the risk-free rate is constant, which may not always be the case. Additionally, the Sharpe ratio does not take into account other types of risk, such as liquidity risk or market risk, which may be important for some investors.
To calculate the Sharpe ratio, investors will need to determine the investment’s return, the risk-free rate, and the standard deviation of the investment’s returns. The risk-free rate is typically the return on a U.S. Treasury bond, and the standard deviation can be calculated using historical data on the investment’s returns.
Understanding The Treynor ratio
The Treynor ratio, also known as the reward-to-volatility ratio, is a measure of the excess return of an investment over the risk-free rate per unit of systematic risk (also known as beta). It is calculated as the difference between the investment’s return and the risk-free rate, divided by the investment’s beta.
For example, let’s say an investor is considering two different investments: Investment A has a return of 10% and a beta of 1.5, while Investment B has a return of 8% and a beta of 1.2. The Treynor ratio for Investment A would be (10%-0%)/1.5 = 6.67, while the Treynor ratio for Investment B would be (8%-0%)/1.2 = 6.67. In this case, both investments have the same Treynor ratio, indicating that they have the same risk-adjusted return profile.
The Treynor ratio can be a useful tool for comparing the risk-adjusted returns of different investments or portfolios. It has the advantage of taking into account systematic risk, which is the risk inherent to the market as a whole and cannot be diversified away. However, it does not take into account other types of risk, such as unsystematic risk (which is specific to a particular investment or industry) or non-market risk (such as liquidity risk).
To calculate the Treynor ratio, investors will need to determine the investment’s return, the risk-free rate, and the investment’s beta. The risk-free rate is typically the return on a U.S. Treasury bond, and the beta can be calculated using historical data on the investment’s returns and the overall market.
Comparing the Sharpe ratio and the Treynor ratio:
The Sharpe ratio and the Treynor ratio are both measures of risk-adjusted returns that are used to compare the profitability of different investments or portfolios. However, there are some key differences between the two measures.
One key difference is the type of risk that each measure takes into account. The Sharpe ratio measures the excess return of an investment over the risk-free rate per unit of total risk, as measured by the standard deviation of the investment’s returns. The Treynor ratio, on the other hand, measures the excess return of an investment over the risk-free rate per unit of systematic risk, as measured by the investment’s beta.
Another difference is the assumptions that each measure makes about the risk-free rate. The Sharpe ratio assumes that the risk-free rate is constant, while the Treynor ratio does not make this assumption.
So, when is it more appropriate to use the Sharpe ratio versus the Treynor ratio? Both measures can be useful depending on the situation. If an investor is primarily concerned with total risk, the Sharpe ratio may be a better choice. On the other hand, if an investor is more concerned with systematic risk, the Treynor ratio may be a more appropriate measure.
Ultimately, the most appropriate risk-adjusted return measure for a particular investment or portfolio will depend on the specific goals and risk tolerance of the investor, as well as the characteristics of the investment itself. Investors should
Case studies:Risk Adjusted Returns
There are many examples of successful investments that were made using risk-adjusted return measures. Here are a few case studies to illustrate how these measures can be used in practice:
- In the early 1980s, Warren Buffett made a series of investments in companies that were selling at a discount to their intrinsic value, as measured by the Ben Graham formula. The Ben Graham formula is a measure of the intrinsic value of a company that takes into account its earnings, dividends, and book value. By using this measure, Buffett was able to identify undervalued companies with the potential for significant returns.
- In the 1990s, hedge fund manager Paul Tudor Jones used the Sharpe ratio to guide his investments in the foreign exchange market. Jones focused on investments with a high Sharpe ratio, indicating a favorable risk-adjusted return profile, and was able to achieve significant returns for his investors.
- In the early 2000s, investor Peter Lynch used the Treynor ratio to guide his investments in the technology sector. Lynch focused on investments with a high Treynor ratio, indicating a favorable risk-adjusted return profile, and was able to achieve strong returns for his investors.
In each of these cases, the investors used measures to identify investments with the potential for strong returns while also considering the level of risk involved. By using these measures as part of their investment decision-making process, they were able to make more informed decisions and achieve better outcomes.
Conclusion:Risk Adjusted Returns
In conclusion, risk-adjusted returns are a measure of the profitability of an investment that takes into account the level of risk involved. There are several different measures of risk-adjusted returns, including the Sharpe ratio and the Treynor ratio, which can be useful for comparing the risk-adjusted returns of different investments or portfolios.
By considering risk-adjusted returns when evaluating investment options and assessing the performance of their portfolio, investors can make more informed decisions and potentially achieve better outcomes. It is important to note, however, that risk-adjusted returns are just one factor to consider when making investment decisions, and investors should also consider other factors such as their overall risk tolerance and financial goals.
If you are interested in learning more about investment management, there are many additional resources available. These may include financial websites, investment books, and professional financial advisors. By doing your own research and seeking out guidance from trusted sources.
Keep Following InveShares for more such awesome content right here!
FAQ : Risk Adjusted Returns
A: Risk-adjusted returns are a measure of the profitability of an investment that takes into account the level of risk involved. They allow investors to compare different investment options and make more informed decisions by considering both the potential returns and the risks associated with each option.
A: There are several different ways to measure risk-adjusted returns, including the Sharpe ratio and the Treynor ratio. The Sharpe ratio measures the excess return of an investment over the risk-free rate per unit of risk, while the Treynor ratio measures the excess return of an investment over the risk-free rate per unit of systematic risk. Both of these measures can be useful for evaluating the performance of an investment or portfolio and comparing it to other options.
A: Risk is an inherent part of investing, and it is important for investors to consider the level of risk associated with any investment they are considering. Ignoring risk can lead to unexpected losses or missed opportunities, as investors may underestimate the potential downside of an investment or overestimate its potential returns. By considering risk in their investment decisions, investors can potentially achieve higher returns and better outcomes.
A: The Sharpe ratio is a measure of the excess return of an investment over the risk-free rate per unit of risk. It is calculated as the difference between the investment’s return and the risk-free rate, divided by the standard deviation of the investment’s returns. To calculate the Sharpe ratio, investors will need to determine the investment’s return, the risk-free rate, and the standard deviation of the investment’s returns.
A: The Treynor ratio, also known as the reward-to-volatility ratio, is a measure of the excess return of an investment over the risk-free rate per unit of systematic risk. It is calculated as the difference between the investment’s return and the risk-free rate, divided by the investment’s beta. Beta is a measure of an investment’s sensitivity to the overall market. To calculate the Treynor ratio, investors will need to determine the investment’s return, the risk-free rate, and the investment’s beta.
A: The Sharpe ratio has a few limitations to consider. For example, it assumes that the risk-free rate is constant, which may not always be the case. Additionally, the Sharpe ratio does not take into account other types of risk, such as liquidity risk or market risk, which may be important for some investors. The Treynor ratio also has limitations to consider. It only considers systematic risk, which means it may not fully capture the level of risk in an investment. Additionally, the Treynor ratio assumes that the risk-free rate is constant, which may not always be the case.
A: In addition to risk-adjusted returns, investors should consider a range of other factors when evaluating an investment. These may include the overall level of risk in the investment, the potential for long-term growth, and the investor’s own financial goals and risk tolerance. By considering a range of factors and using risk-adjusted returns as a guide, investors can make more informed decisions and potentially achieve better outcomes.
A: Risk-adjusted returns allow investors to compare different investment options and make more informed decisions by considering both the potential returns and the risks associated with each option. By choosing investments with a favorable risk-adjusted return profile, investors can potentially achieve higher returns while also minimizing the potential for losses. Overall, risk-adjusted returns can be a valuable tool for helping investors to make more informed and potentially more successful investment decisions.
Risk Adjusted Returns: Understanding the Sharpe Ratio and Treynor Ratio
Risk-adjusted returns are a measure of the profitability of an investment that takes into account the level of risk involved. They allow investors to compare different investment options and make more informed decisions by considering both the potential returns and the risks associated with each option.
There are several different ways to measure risk-adjusted returns, including the Sharpe ratio and the Treynor ratio. The Sharpe ratio measures the excess return of an investment over the risk-free rate (such as the return on a U.S. Treasury bond) per unit of risk. The Treynor ratio measures the excess return of an investment over the risk-free rate per unit of systematic risk (also known as beta). Both of these measures can be useful for evaluating the performance of an investment or portfolio and comparing it to other options.
It is important to note that risk-adjusted returns are just one factor to consider when evaluating an investment. Other considerations may include the overall level of risk in the investment, the potential for long-term growth, and the investor’s own financial goals and risk tolerance. By considering a range of factors and using risk-adjusted returns as a guide, investors can make more informed decisions and potentially achieve better outcomes.