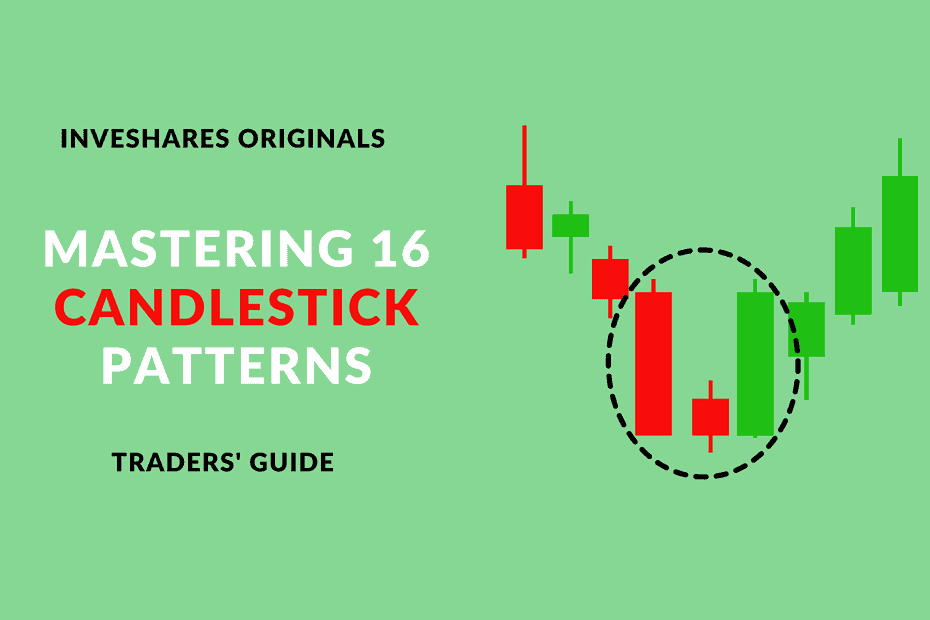
Introduction : Candlestick Patterns
Welcome to our comprehensive guide on mastering 16 essential candlestick patterns that every trader should know. In this article, we will delve into the world of candlestick charting, decoding each pattern’s meaning and significance in the financial markets. Whether you’re a seasoned trader or a newcomer looking to gain insights, our detailed analysis will equip you with the knowledge needed to make informed trading decisions. Let’s dive in!
Understanding Candlestick Charts
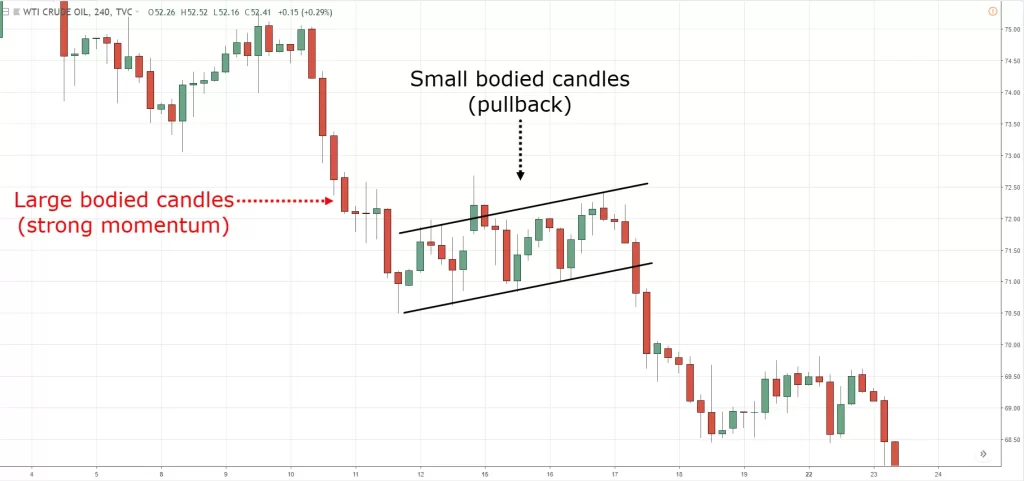
Before we explore the individual candlestick patterns, let’s lay the foundation by understanding what candlestick charts are and how they represent price movements. Candlestick charts are a visual representation of an asset’s price over a specific period. Each candlestick consists of a body and wicks (or shadows) at both ends. The body represents the opening and closing prices, while the wicks indicate the highest and lowest prices during the period.
Candlestick charts have been in use for centuries, tracing their origins back to Japan in the 18th century. The Japanese rice traders used these charts to track the price movements of rice, and over time, they have become an essential tool in technical analysis across various financial markets.
The advantage of using candlestick charts lies in their ability to provide more detailed insights into price action compared to traditional line charts. By incorporating various candlestick patterns, traders can identify potential trend reversals, continuation patterns, and key support and resistance levels, all of which can aid in formulating effective trading strategies.
1. The Bullish Candlestick Patterns
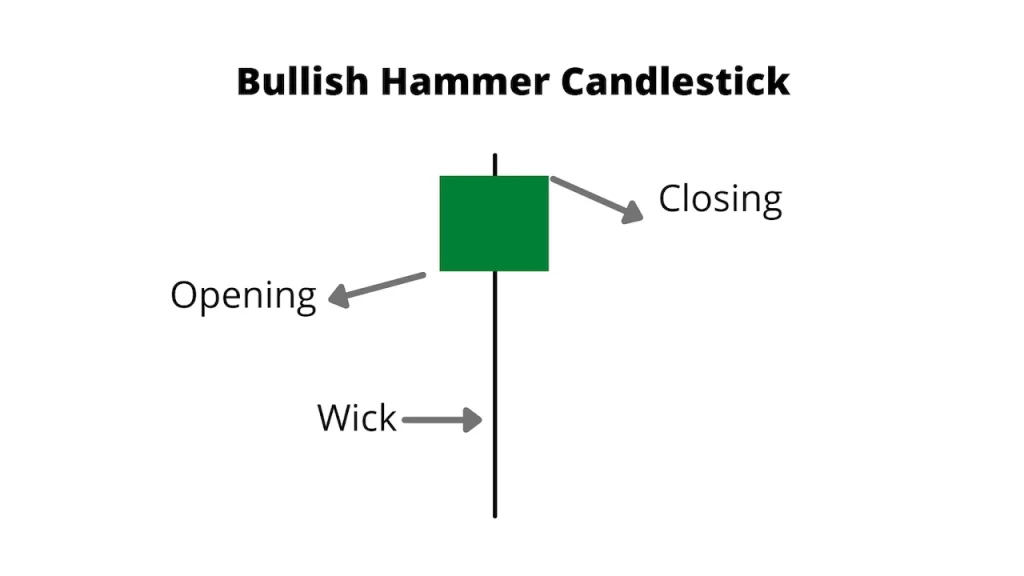
1.1 Hammer
The hammer is a bullish reversal pattern that forms after a downtrend. It has a small body at the top and a long lower wick, resembling a hammer. The pattern suggests a potential trend reversal, with buyers stepping in to drive the price higher from the bottom.
The significance of the hammer pattern lies in the rejection of lower prices during the trading session. It indicates that the bears were unable to maintain control, and the bulls have stepped in with conviction. The longer the lower wick, the stronger the bullish signal, as it reflects a more forceful rejection of lower prices.
Traders often wait for a confirmation candle to follow the hammer pattern before entering a long position. The confirmation candle should ideally close above the hammer’s high, further validating the potential trend reversal.
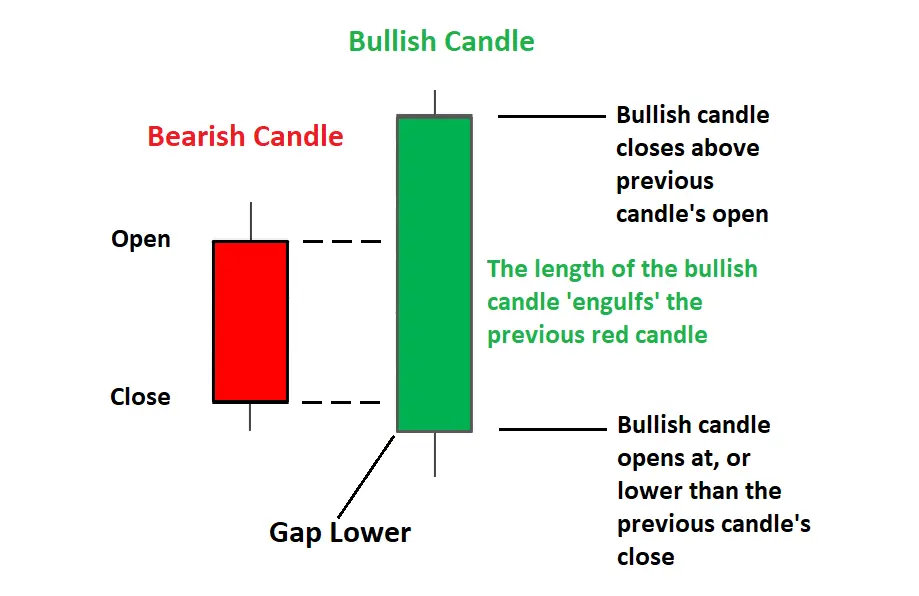
1.2 Bullish Engulfing
The bullish engulfing pattern occurs when a large bullish candle fully engulfs the previous smaller bearish candle. This signifies a shift in sentiment from bearish to bullish, indicating a potential uptrend.
The larger the body of the bullish candle compared to the preceding bearish candle, the stronger the bullish signal. The bullish engulfing pattern suggests that the bulls have overwhelmed the bears, leading to a change in market sentiment.
Traders often use the bullish engulfing pattern as a buy signal, looking for opportunities to enter or add to long positions. However, it is essential to consider the context in which the pattern occurs, such as support and resistance levels or other technical indicators, to avoid false signals.
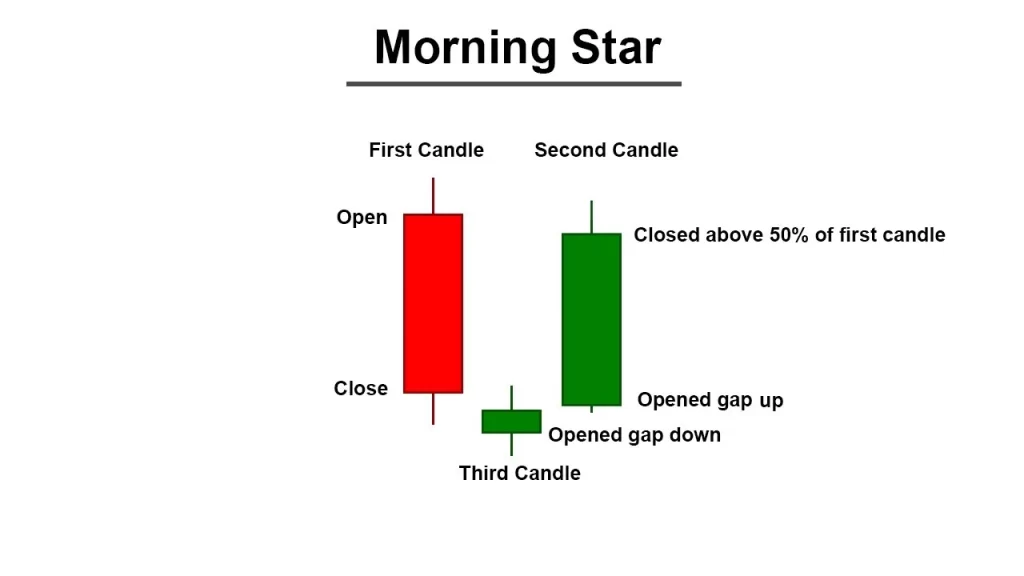
1.3 Morning Star
The morning star is a three-candle bullish reversal pattern. It starts with a bearish candle, followed by a small indecisive candle (doji or spinning top), and concludes with a large bullish candle. This pattern signals a possible trend reversal, with the morning star acting as a harbinger of rising prices.
The morning star pattern is powerful because it indicates a shift in market sentiment from bearish to bullish. The first candle reflects the existing downtrend, followed by the doji or spinning top, which signifies uncertainty or indecision among traders. The final bullish candle confirms the reversal, as the bulls take charge and drive the price higher.
Traders often wait for the confirmation of the third candle to establish a long position. The confirmation is crucial, as it confirms the trend reversal and reduces the risk of false signals.
2. The Bearish Candlestick Patterns
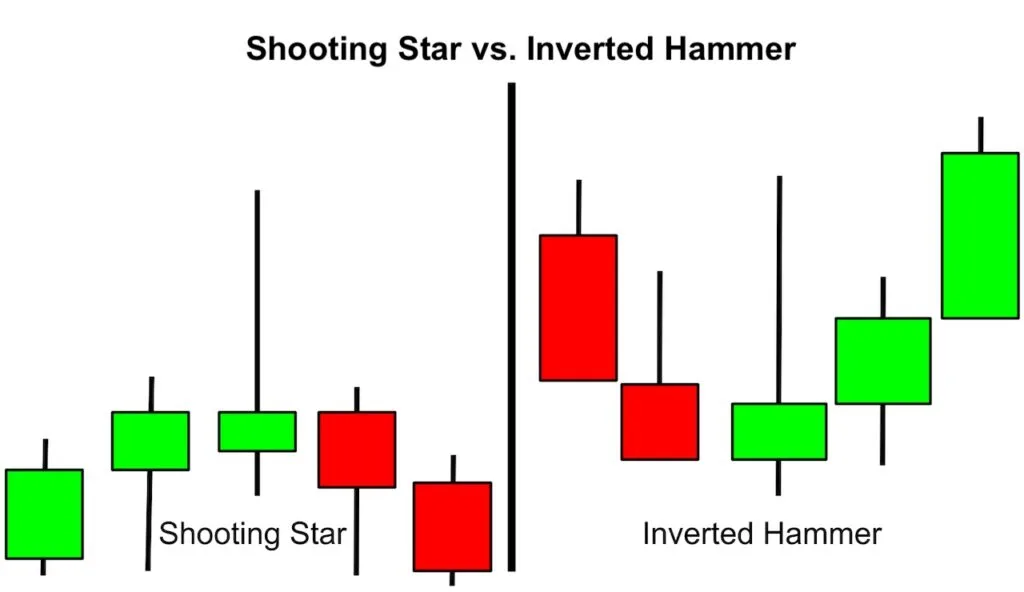
2.1 Shooting Star
The shooting star is a bearish reversal pattern characterized by a small body at the bottom and a long upper wick, resembling an inverted hammer. This pattern forms after an uptrend and suggests a potential reversal to the downside.
The shooting star pattern indicates that the bulls attempted to push the price higher during the trading session but failed, and the bears regained control, pushing the price back down. The long upper wick signifies the rejection of higher prices and the potential for a trend reversal.
Traders often use the shooting star pattern as a sell signal or a warning sign to exit long positions. However, similar to other candlestick patterns, it is crucial to consider other technical indicators and price action context before making trading decisions.
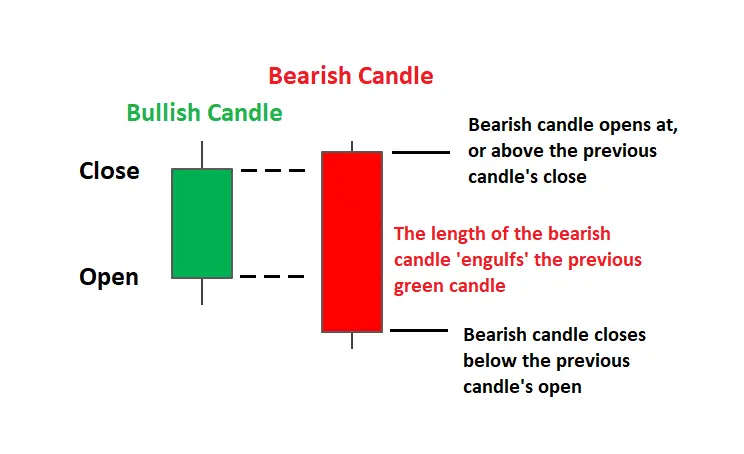
2.2 Bearish Engulfing
The bearish engulfing pattern is the opposite of its bullish counterpart. It occurs when a large bearish candle fully engulfs the previous smaller bullish candle, indicating a shift from bullish to bearish sentiment and a potential downtrend.
Similar to the bullish engulfing pattern, the bearish engulfing pattern suggests a change in market sentiment, with the bears overwhelming the bulls. The larger the body of the bearish candle compared to the preceding bullish candle, the stronger the bearish signal.
Traders often use the bearish engulfing pattern as a sell signal, looking for opportunities to enter or add to short positions. However, as with any trading signal, it is essential to analyze the broader market context and consider risk management strategies.
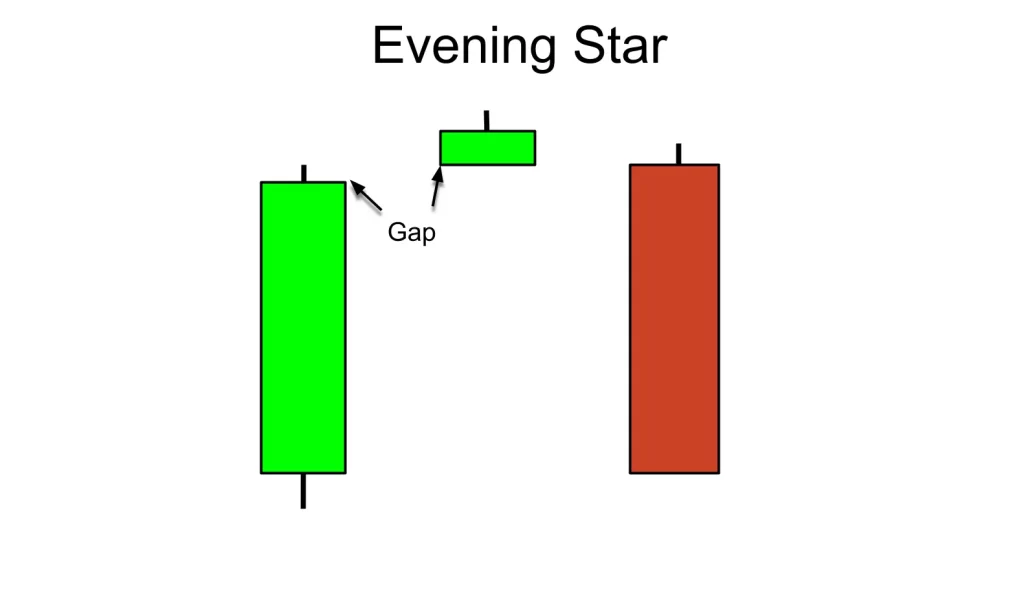
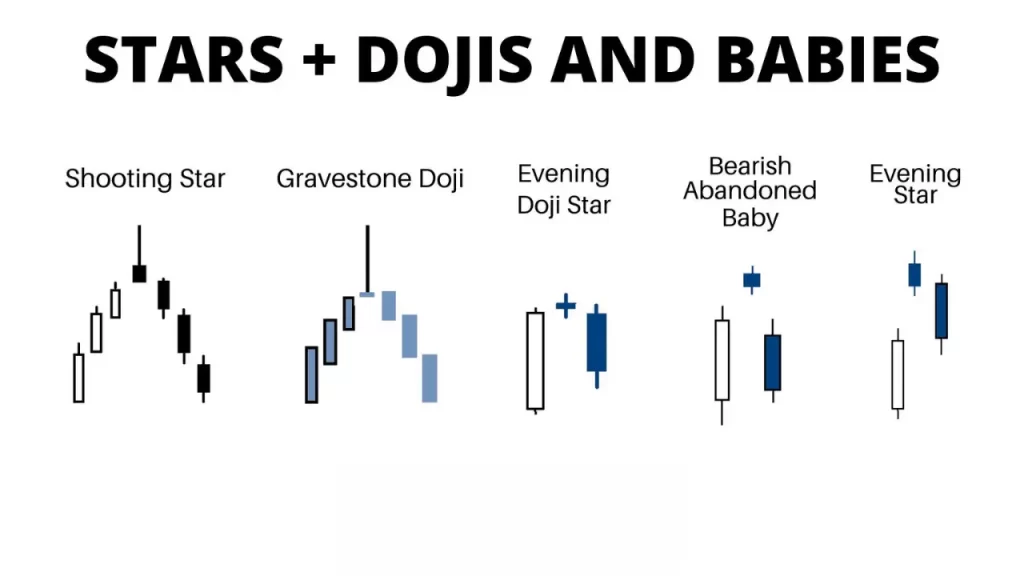
2.3 Evening Star
Similar to the morning star, the evening star is a three-candle pattern signaling a bearish reversal. It starts with a bullish candle, followed by a small indecisive candle, and concludes with a large bearish candle. The evening star pattern warns traders of a possible trend reversal to the downside.
The evening star pattern indicates a shift in market sentiment from bullish to bearish, with the first bullish candle reflecting the existing uptrend. The small indecisive candle represents uncertainty among traders, and the final bearish candle confirms the reversal as the bears take control.
Traders often wait for the confirmation of the third candle before establishing short positions. The confirmation helps validate the trend reversal and reduces the risk of false signals.
3. Continuation Candlestick Patterns
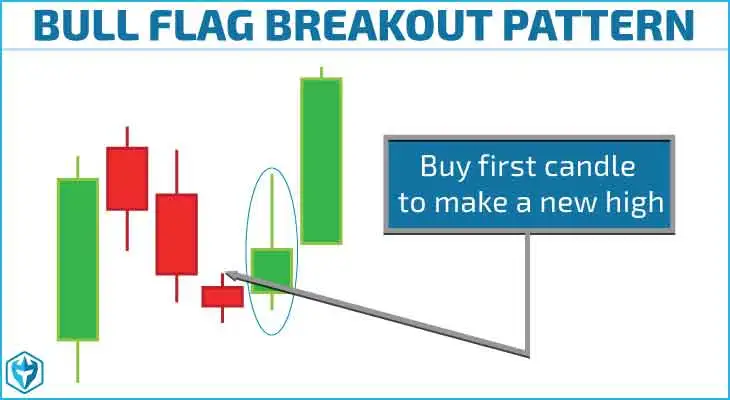
3.1 Bullish Flag
The bullish flag is a continuation pattern that forms after a strong upward price movement. It appears as a brief consolidation period before the prevailing uptrend resumes, making it an opportunity for traders to enter or add to their long positions.
The bullish flag pattern is characterized by a sharp, almost vertical price rise (flagpole) followed by a parallel consolidation (flag). The flag’s consolidation phase represents a temporary pause in the uptrend, with the bulls taking a breather before pushing the price higher.
Traders often use the bullish flag pattern as a buy signal, looking for opportunities to capitalize on the continuation of the uptrend. However, it is essential to exercise caution and apply risk management strategies to protect against potential false breakouts.
3.2 Bearish Flag
The bearish flag is the bearish counterpart of the bullish flag and forms after a significant downward price movement. It represents a temporary pause in the downtrend, indicating that the bears might regain control and push the price lower.
Similar to the bullish flag, the bearish flag pattern consists of a sharp, almost vertical price decline (flagpole) followed by a parallel consolidation (flag). The flag’s consolidation phase indicates a temporary respite for the bears before resuming the downtrend.
Traders often use the bearish flag pattern as a sell signal, looking for opportunities to capitalize on the continuation of the downtrend. As with any trading strategy, it is essential to consider other technical indicators and market context to avoid potential false signals.
4. Reversal Candlestick Patterns
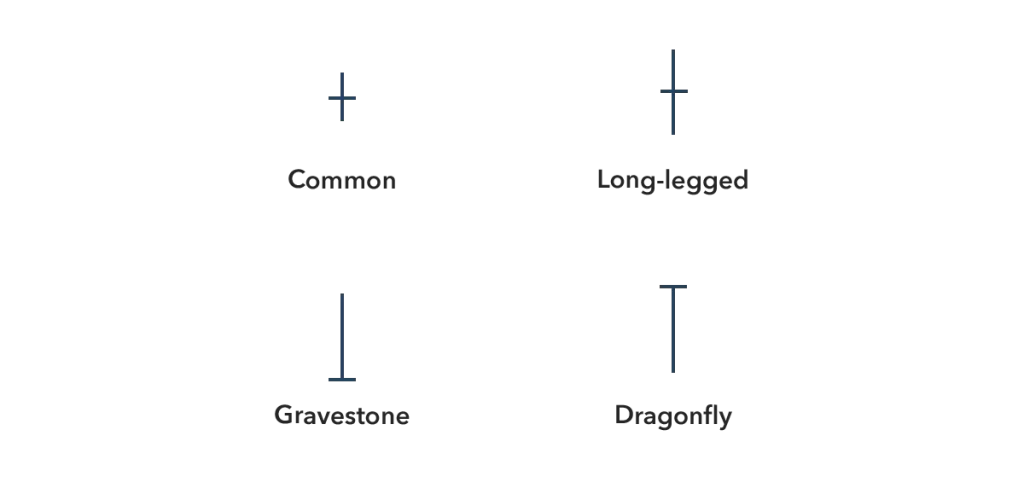
4.1 Doji
The doji is a single candle pattern with a small body, where the opening and closing prices are almost identical. It signals indecision in the market and potential trend reversal, especially after an extended price move.
The doji pattern indicates a tug-of-war between the bulls and bears, resulting in a balanced market sentiment. Traders often interpret the doji as a sign of potential trend reversal, as it suggests that neither the bulls nor the bears have taken control.
It is essential to consider the doji pattern within the broader context of the price action. A doji after a prolonged uptrend or downtrend might indicate an impending reversal, but traders should look for additional confirmation before making trading decisions.
4.2 Evening Doji Star
The evening doji star is a three-candlestick pattern that combines a doji with an evening star. It strengthens the bearish reversal signal, indicating a high probability of a trend reversal to the downside.
The evening doji star pattern starts with a bullish candle, followed by a doji, and concludes with a large bearish candle. The combination of the doji’s indecision and the bearish candle’s conviction further suggests a shift in market sentiment from bullish to bearish.
Traders often use the evening doji star pattern as a sell signal, looking for opportunities to establish short positions or exit existing long positions. However, as with any trading signal, it is crucial to consider other technical indicators and market context for confirmation.
Conclusion : Candlestick Patterns
In conclusion, mastering candlestick patterns is a crucial skill for any trader seeking to gain a competitive edge in the financial markets. By understanding the nuances of these patterns and recognizing their significance, traders can make well-informed decisions and improve their trading strategies. Remember, practice and experience play a pivotal role in honing your skills, so make sure to apply your knowledge through real-world trading scenarios.
Now, armed with the insights from this comprehensive guide, you are ready to take on the markets with confidence. Happy trading!
For more such interesting information keep following InveShares!!
FAQ : Candlestick Patterns
Q1: What are candlestick charts, and why are they essential for traders?
A1: Candlestick charts are a visual representation of an asset’s price over a specific period. They display the opening, closing, highest, and lowest prices during the time frame. Candlestick charts provide more detailed insights into price action compared to traditional line charts, making them essential for technical analysis and identifying potential trading opportunities.
Q2: How can traders use candlestick patterns for decision-making?
A2: Traders can use candlestick patterns to make informed decisions about their trades. By understanding the various candlestick patterns, traders can recognize potential trend reversals, continuation patterns, and key support and resistance levels. This knowledge helps them formulate effective trading strategies and improves their chances of making profitable trades.
Q3: What is the significance of the hammer pattern in candlestick charting?
A3: The hammer pattern is a bullish reversal pattern that forms after a downtrend. Its significance lies in the potential trend reversal it suggests. The long lower wick indicates strong buying pressure, as buyers step in to drive the price higher from the bottom. Traders often use the hammer pattern as a buy signal, looking for opportunities to enter or add to long positions.
Q4: How does the evening star pattern indicate a bearish reversal?
A4: The evening star pattern is a three-candlestick pattern signaling a bearish reversal. It starts with a bullish candle, followed by a small indecisive candle, and concludes with a large bearish candle. This pattern warns traders of a possible trend reversal to the downside, as it reflects a shift in market sentiment from bullish to bearish.
Q5: What is the role of confirmation candles in candlestick pattern analysis?
A5: Confirmation candles play a crucial role in validating the reliability of candlestick patterns. Traders wait for a confirmation candle to follow certain patterns, such as the hammer or morning star, before making trading decisions. The confirmation candle confirms the potential trend reversal, reducing the risk of false signals and increasing the likelihood of a successful trade.
Q6: How can traders use bullish flag patterns for trading?
A6: Bullish flag patterns are continuation patterns that appear after a strong upward price movement. The flag’s consolidation phase represents a temporary pause in the uptrend. Traders often use the bullish flag pattern as a buy signal, looking for opportunities to capitalize on the continuation of the uptrend.
Q7: What is the significance of the doji pattern in candlestick charting?
A7: The doji pattern is a single candle with a small body, indicating indecision in the market. It often appears after an extended price move and signals potential trend reversals. Traders interpret the doji pattern as a warning sign for possible changes in market sentiment, prompting them to exercise caution and look for additional confirmation before making trading decisions.
References : Candlestick Patterns
Websites:
- Investopedia – Candlestick Charts Explained
- Investopedia – Hammer Candlestick Pattern
- Investopedia – Bullish Engulfing Pattern
Books:
- “Japanese Candlestick Charting Techniques” by Steve Nison
- “The Candlestick Course” by Steve Nison
- “Technical Analysis of the Financial Markets” by John J. Murphy