Stock Market is a great way to earn a lot of money and keep yourself informed about the latest companies and their products and services. However, if you’re new to Stock Market, you must be a little hesitant. But don’t worry because I’ll answer some of the biggest technical Stock market questions in this post.
The average return on investment in Stock Market is more than $37 for every dollar you spend. That’s the highest ROI you can expect from any type of Investing. It’s huge, and it’s practical. So it’s important to understand the basic concept behind it! So let’s start with the questions now.
#1 What is a Technical Analysis?
A technical analysis is a method of analyzing price movements and trends in order to identify and predict future patterns.The best article which lets you know all about technical stuff is linked here.
#2 What are the Most common Technical Indicators?
Some of the most common technical indicators include moving averages, Bollinger bands, Relative Strength Index (RSI), and MACD. These Indicatores may prove to be worth a lot when used correctly. Technical Indicators are quantitative in nature. Some of the Technical Indicators are Listed below:
- On-Balance Volume
- Accumulation/Distribution Line
- Average Directional Index
- Aroon Indicator
- MACD
- Relative Strength Index
- Stochastic Oscillator
#3 What is a moving average?
A moving average is a technical indicator that calculates the average price of a security over a given period of time.If you want to know more about the best moving average strategy, you can learn it from siddhart bhanushali sir. He teaches the best 44 simple moving average strategy.
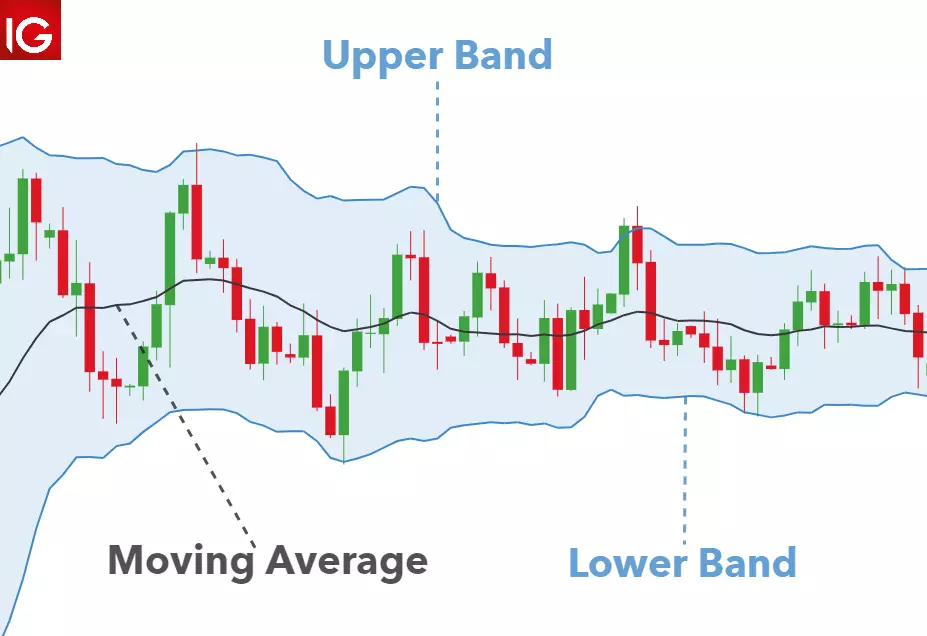
#4 What is Bollinger bands?
Bollinger bands are a technical indicator that measures the volatility of a security. They are created by plotting two standard deviation lines above and below a simple moving average.
#5 What is Relative Strength Index (RSI)?
The Relative Strength Index (RSI) is a technical indicator that measures the magnitude of recent price changes to identify overbought or oversold conditions. Foounded by Welles Wilder, it is a momentum oscillator that measures the speed and change of price movements. The RSI oscillates between zero and 100. Traditionally the RSI is considered overbought when above 70 and oversold when below 30.
#6 What is MACD/MAC in Stock Market?
moving average convergence divergence (MACD) is a fashion-following momentum indicator that suggests the relationship among two moving averages of a security’s price. The MACD is calculated by means of subtracting the 26-period exponential moving average (EMA) from the 12-period EMA.
#7 What are the expected growth rates of the technology markets in 2022?
There is no one definitive answer to this question, as it depends on a variety of factors including global economic conditions, technological advances, and the preferences of individual investors. However, some analysts believe that the technology markets will continue to grow at a relatively fast pace over the next several years.
#8 What are some of the key trends that are likely to Affect the technology markets in 2022?
Some of the key trends that are likely to Affect the technology markets in 2022 include increasing demand for mobile and cloud-based applications, growing interest in artificial intelligence and machine learning, and continued growth in the global e-commerce sector.
#9 What are some of the key challenges that are likely to affect the technology markets next year?
Some of the key challenges that are likely to affect the technology markets in 2022 include increased competition from other sectors, increased cyber-attacks, and the potential for a slowdown in global Markets.
#10 What are the benefits of technical stock market analysis?
There are a few key benefits of technical stock market analysis. One is that it can help investors spot trends and patterns in stock prices. This information can then be used to make informed investment decisions. Additionally, technical analysis can help investors to better time their buying and selling decisions, which can lead to increased profits. I would also link the best stock market trading strategy, the price action trading strategy here.
#11 What is a stock chart?
A stock chart is a visual representation of a security’s price movement over a specific period of time. It can be used to help investors spot trends and patterns in stock prices.
#12 What is a candlestick chart?
A candlestick chart is a type of stock chart that is used by traders to determine possible price movement based on past patterns. Candlesticks are useful when trading as they show four price points (open, close, high, and low) throughout the period of time the trader specifies. These charts often help to read the emotions of the market.
#13 What is a stock?
A stock is a share in the ownership of a company. When you buy a stock, you become a part owner of that company. Here we would let you know some of the best stock for future on this website.
#14 What is a mutual fund?
A mutual fund is an investment vehicle that allows investors to pool their money together and invest in a variety of assets, such as stocks, bonds, and money market instruments.

#15 What is a bond?
A bond is a debt security that pays interest at fixed intervals until it matures. When you purchase a bond, you are lending money to the Government and they pay you yearly interest on that money. Generally, the Bond prices are inversely correlated with interest rates: when rates go up, bond prices fall and vice-versa.
#16 What is the best time frame to use for technical analysis?
Again, there is no one definitive answer to this question. Many traders prefer to use shorter time frames such as 5 or 15 minutes to spot trends more quickly. Others prefer to use longer time frames such as daily or weekly charts to get a more complete picture of the market.
#17 What is the stock market?
The stock market is a collection of markets where stocks (pieces of ownership in businesses) are traded between investors.The stock market broadly refers to the collection of exchanges and other venues where the buying, selling, and issuance of shares of publicly held companies take place. Such financial activities are conducted through institutionalized formal exchanges (whether physical or electronic) or via over-the-counter (OTC) marketplaces that operate under a defined set of regulations.

#18 What is the Dow Jones Industrial Average (DJIA)?
The Dow Jones Industrial Average (DJIA) is a price-weighted average of 30 blue chip stocks that are traded on the New York Stock Exchange.
#19 What is the S&P 500?
The S&P 500 is a market-capitalization weighted index of 500 stocks that are traded on the New York Stock Exchange and the NASDAQ. The S&P 500, which is short for Standard & Poor’s 500, was introduced in 1957 as a stock market index to track the value of 500 corporations that have their stocks listed on the New York Stock Exchange (NYSE) and the NASDAQ Composite.
#20 What is a stock split?
A stock split is when a company increases the number of shares outstanding by issuing more shares to its shareholders. This usually happens when the stock price gets too high and the company wants to make it more affordable for retail investors to buy shares.

#21 What is a security?
A security is a financial instrument that represents an ownership stake in a company or investment. Securities can include stocks, bonds, options, and futures.
#22 What is a stock market crash?
A stock market crash is a sudden and dramatic decline in the stock market. The term is often used to describe a sell-off in the stock market that causes a significant percentage of stocks to lose a large amount of value in a short period of time.
Ask Your Stock Market Questions
Stock Market is a great way to reach your customers and promote your business. In addition, there are many ways to make money with email marketing. The average ROI of email marketing is $37 for every dollar spent. However, you need to make sure that your Stock Market practices comply with the best trading strategy( The Price Action Trading Strategy).
I wish you the best of luck with your Stock Market efforts! Download this Stock Market eBook to improve your knowledge about the subject even more.
If I have missed some Stock Market questions, post them in the comments below or on InveShares Telegram Group, and I’ll do my best to answer them.