Introduction : Price Action Trading Strategy
Price action trading strategy describes the characteristics of a security’s price movements. This movement is quite often analysed with respect to price changes in the recent past. In simple terms, price action is a trading technique that allows a trader to read the market.And make subjective trading decisions based on the recent and actual price movements, rather than relying solely on technical indicators.
Since it ignores the fundamental analysis factors and focuses more on recent and past price movement, the price action trading strategy is dependent on technical analysis tools.
Many day traders focus on price action trading strategies to quickly generate a profit over a short time frame. For example, they may look for a simple breakout from the session’s high, enter into a long position, and use strict money management strategies to generate a profit. For a complete guide on best day trading strategies please check the day trading post by inveshares.
What is a price action trading strategy?
Price Action Trading (P.A.T.) is the discipline of making all of your trading decisions from a stripped down or “naked” price chart. This means no lagging indicators outside of maybe a couple moving averages, to help identify dynamic support and resistance areas and trend. All financial markets generate data about the movement of the price of a market over varying periods of time; this data is displayed on price charts. Price charts reflect the beliefs and actions of all participants (human or computer) trading a market during a specified period of time. And these beliefs are portrayed on a market’s price chart in the form of “price action” (P.A.).
Whilst economic data and other global news events are the catalysts for price movement in a market, we don’t need to analyze them to trade the market successfully. The reason is pretty simple; all economic data and world news that causes price movement within a market is ultimately reflected via P.A. on a market’s price chart.
Since a market’s P.A. reflects all variables affecting that market for any given period of time, using lagging price indictors like stochastics, MACD, RSI, and others is just a flat waste of time. Price movement provides all the signals you will ever need to develop a profitable and high-probability trading system. These signals collectively are called price action trading strategies. They provide a way to make sense of a market’s price movement and help predict its future movement with a high enough degree of accuracy to give you a high-probability trading strategy.
The rules of the strategy
Price action trading is simplistic, and most systems usually have a two-step process for identifying and taking advantage of trading opportunities in the market. The steps are as follows:
1. Identify the Prevailing Market Conditions
As mentioned above, a market can either be in an uptrend, downtrend or moving sideways. By observing asset prices, traders should quickly be able to tell what phase of price action the market is in at that moment.
2. Identify the Trading Opportunity
After identifying the prevailing market condition, a trader then proceeds to establish whether there is an actionable trading opportunity. For instance,in an uptrend , the price action should tell the trader whether prices will continue extending higher, or whether a retracement is expected. An example of a price action trade is when the gold price has been trending higher and is approaching $2,000. If it successfully breaks that level, then $2,000 will now be the new support area. A long position will now be entered after a pullback fails to break below $2,000. If an earlier support level was $1,980, the price action trader would place a stop loss level below that price, which is exactly where the uptrend will be deemed invalid. The exit on the trade can be triggered when the trader satisfies their risk/reward ratio, or when the market does not make higher highs and higher lows.
Price action strategies involve reading the psychology of the market participants by watching price changes in the market.
Most reliable price action setups
1.Long Wick Candles
A candle in the market is depicted by a body and wick(s). The body is the distance between the opening and closing prices, while the wicks represent the extremes (the high and low achieved). Long wick candles are a favourite for price action traders. For instance, a candle with a long upper wick shows that in that period, buyers attempted to push prices higher by some distance, but sellers resisted the attempt and even managed to return prices close to the opening price. With this information, a price action trader can back the sellers again in the succeeding period or can wait for confirmation. Either way, long wick candles are a must-watch for price action traders.
2.Inside Bar After Breakouts
When breakouts occur, the challenge for traders is if it is a genuine one or a fake one. An inside bar breakout pattern is when one or more candles trade within the highs and lows of the large breakout candle, hence the name ‘inside’. The psychology for the setup is that market participants are unwilling to give back any breakout gains and are ready to defend and back the new trend going forward.
3.Trendline Trading
Trendline trading involves the use of lines to establish the optimal points to enter trades in trending markets. In an uptrend, a trendline is drawn from a particular swing low to a subsequent one and then projected into the future. Retracements to the trendline represent an ideal price point to join the uptrend. Horizontal trendlines can be used in ranging markets to map out support and resistance areas.
How to trade the Strategy (With Examples)
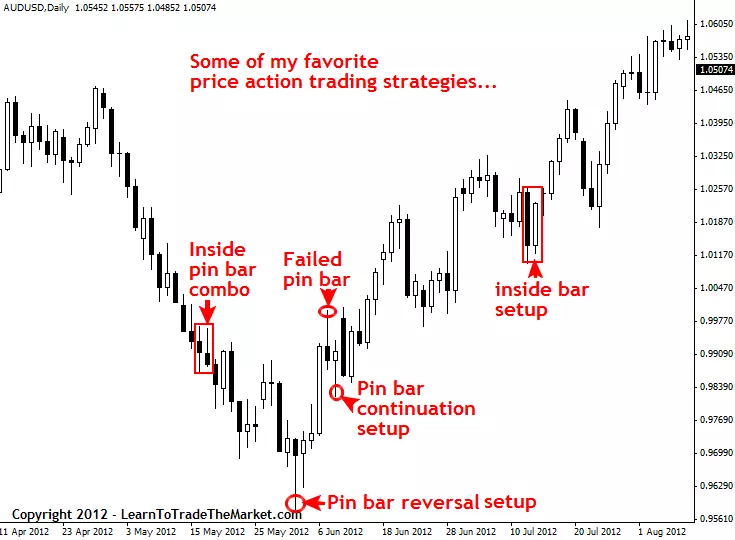
Next, let’s take a look at some of the price action trading strategies that I teach. Note that I’ve included a “failed” trade setup because not every trade will be a winner; we aren’t here to show you “perfect” past trading results…we are here to teach you in an honest and realistic manner.
In the image example below, we are looking some of my favorite P.A.(Price Action) trading strategies:
Determine a market’s trend using price action
One of the most important aspects of learning to trade with P.A. is to first learn how to identify a trending market versus a consolidating market. Trading with the trend is highest-probability way to trade and it’s something you HAVE TO learn how to do if you want to stand a chance at making serious money as a trader.
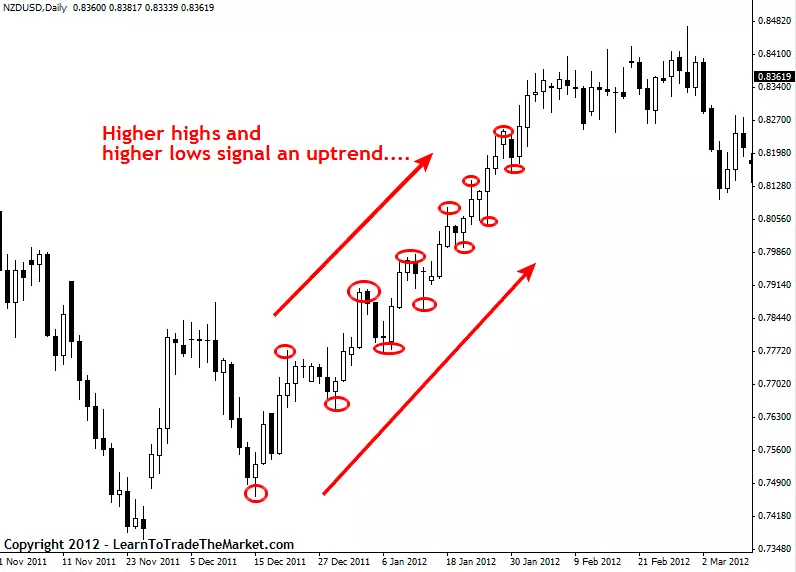
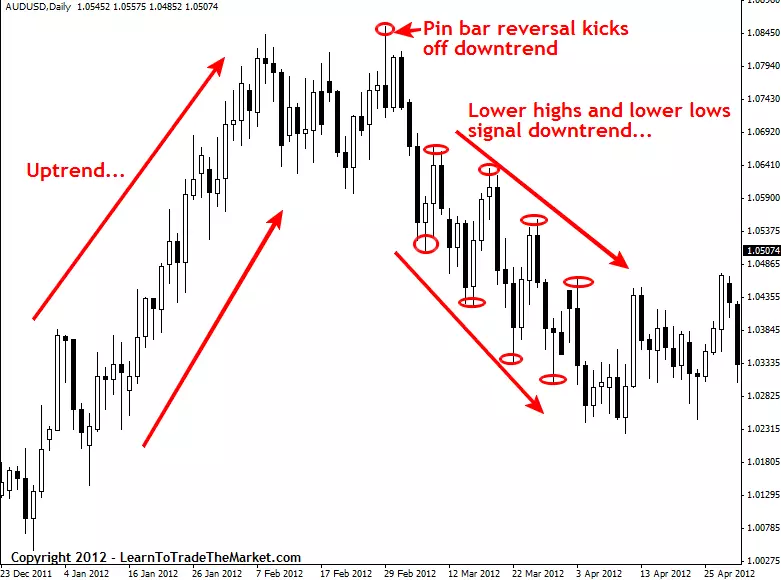
The charts below shows how to use price dynamics to determine a markets trend. We consider a market to be in an uptrend if it is making Higher Highs and Higher Lows (HH, HL) and a downtrend is Lower Highs and Lower Lows (LH, LL).
In the image example below, we can see how higher highs and higher lows signal an up-trend in a market:
In the image example below, we can see how lower highs and lower lows signal a down-trend in a market:
Determine Trending VS Consolidating markets using price action
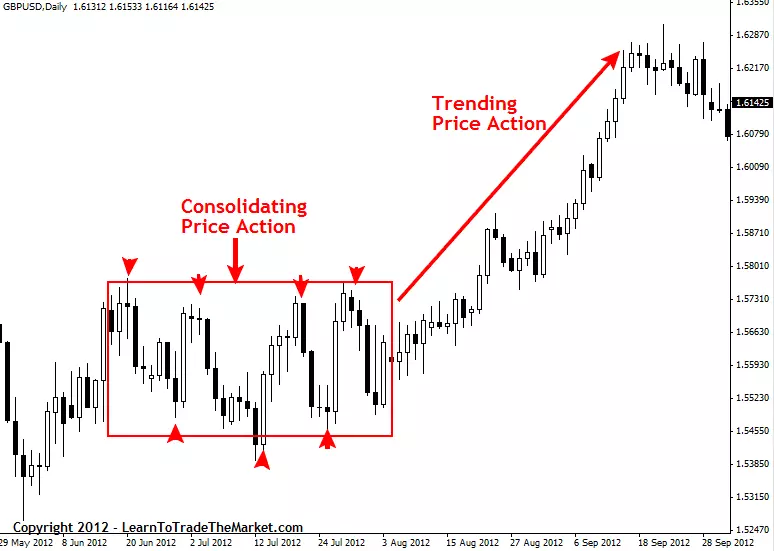
As we discussed earlier, P.A.or “price action trading analysis” is the analysis of the price movement of a market over time. From our analysis of price movement we can determine a market’s underlying directional bias or “trend”, or if the market has no trend it is said to be “consolidating”…we can easily determine whether a market is trending or consolidating from simply analyzing its P.A.. We saw how to determine a market’s trend above, to determine if a market is consolidating we just look for an absence of the HH, HL or LH, LL patterns. In the chart below note how the “consolidating price action” is bouncing between a horizontal support and resistance level and is not making HH, HL or LH, LL but is instead going sideways…
The image example below shows a market moving from a consolidation phase to a trending phase:
How to Exactly Trade with Price Action Trading Strategy
So how exactly do we trade with price action? It really boils down to learning to trade P.A. setups or patterns from confluent levels in the market. Now, if that sounds new or confusing to you right now, sit tight and I will clarify it soon. First we need to cover a couple more things:
Due to the repetitive nature of market participants and the way they react to global economic variables, the P.A. of a market tends to repeat itself in various patterns. These patterns are also called price action trading strategies, and there are many different price action strategies traded many different ways. These reoccurring price patterns or price action setups reflect changes or continuation in market sentiment. In layman’s terms, that just means by learning to spot price action patterns you can get “clues” as to where the price of a market will go next.
The first thing you should to begin P.A. trading is to take off all the “crap” on your charts. Get rid of the indicators, expert advisors; take off EVERYTHING but the raw price bars of the chart. I prefer to use candlestick charts because I feel they convey the price data of the market more dynamically and “forcefully”, if you are still using classic bar charts and want more info on candlesticks then checkout this candlestick trading tutorial.
I like simple black and white charts the best, as you can see below. In metatrader4 you simply right click on the chart and adjust the “properties” of the chart to get it looking like mine below. If you want more info on how to setup your MT4 trading platform checkout this metatrader 4 tutorial.
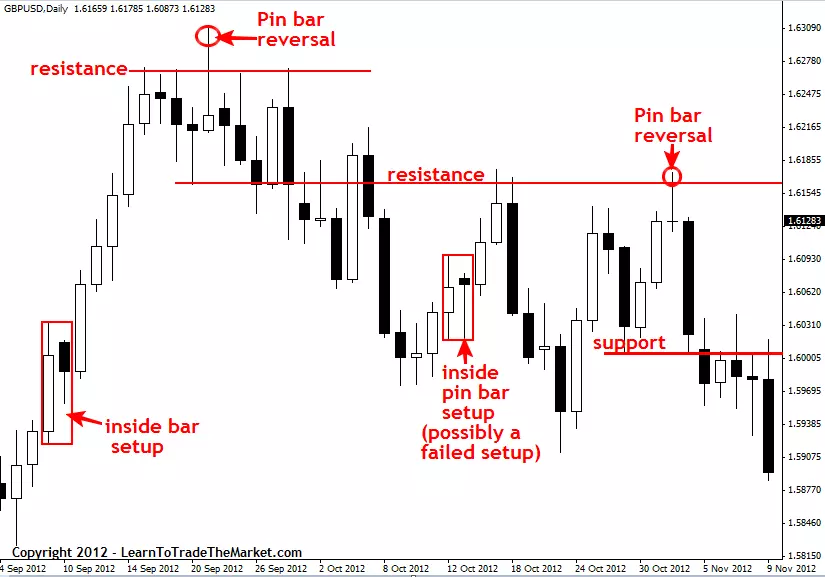
After you’ve removed all the indicators and other unnecessary variables from your charts, you can begin drawing in the key chart levels and looking for price action setups to trade from.
The image example below shows examples of some of the trading strategies I teach in my price action trading course. Note the key support / resistance levels have been drawn in:
Final Words
Price action trading is a powerful way of picking out and trading high probability trading opportunities in the market. Open a free AvaTrade demo account and try out different price action strategies today!
Price action trading can work wonders; however the trader must understand that it requires a high degree of patience to successfully trade the markets using price action. There are very specific setups that a price trader will look for on the charts, and these could take some time to develop. Entering a trade before the optimal time can lead to losing trades, and lost money. If a trader wishes to use a price action strategy when trading they must be sure to have a specific plan for entries and exits, and they must stick to that plan. Just have patience and master this awesome strategy!
Get more awesome and informative content here!